bók byggir próf «Spiral Dynamics:
Mastering Values, Leadership, and
Change» (ISBN-13: 978-1405133562)
Styrktaraðilar

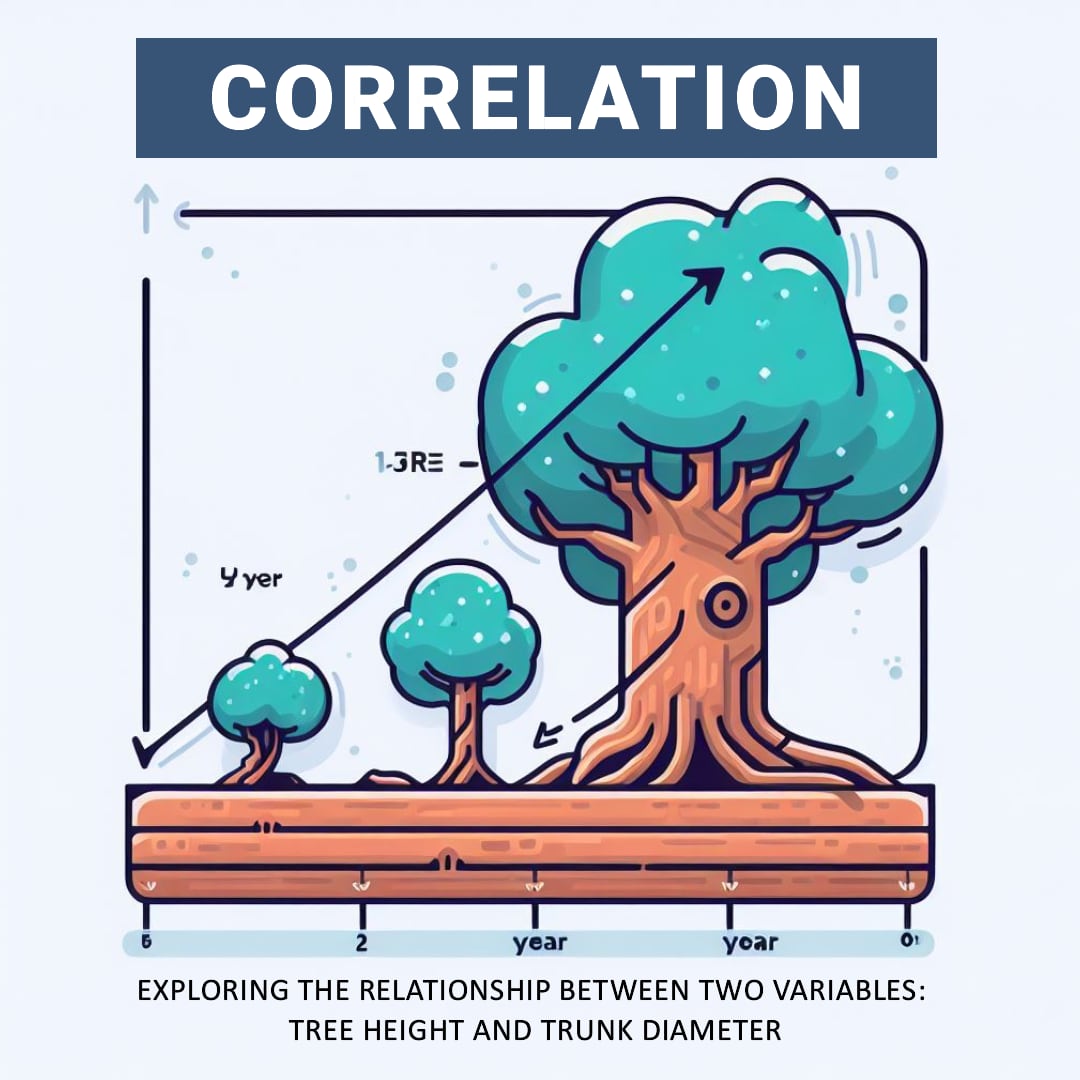
The Tale of the Tall Oak

Once upon a time, there was a tiny oak tree sapling named Peety. Peety dreamed of growing up into a mighty oak tree. 


Each year, Peety grew a little bit taller. He stretched his branches toward the sun and felt his trunk thicken as he grew. 


Over many years, Peety grew from a sapling into a young tree and finally into a tall, mature oak! He was so tall that he could see over the whole forest.


Peety noticed that the other tall oak trees had thick trunks, too. His friend Paul reached high into the sky just like Peety. Paul's trunk was thick and sturdy at the base. 


The small saplings that were sprouting had skinny little trunks. But Peety knew that would change over time as they grew taller.


Peety realized that, just like him, the taller an oak tree was, the thicker its trunk became. 


So even though the forest was filled with all different sizes of oak trees, Peety noticed a pattern - a correlation between tree height and trunk width. The tall trees always had thicker trunks, while the small saplings had skinny trunks. This was how pine trees grew strong enough to reach great heights! 


If you record how a tree grows - its height and trunk thickness - and plot it on a picture or graph, then the correlation is when these two things change together. That is, if you see that one is increasing, the other is also increasing, and vice versa.


The SDTEST® gives clues to someone's motivational values. However, additional polls can provide more pieces of the puzzle.


Imagine also giving a "Fears" poll. It asks people to rate different fears from 0 (not scary) to 5 (very scary). 


Now imagine 100 people who took both tests. You could match up each person's SDTEST® colors with their rated fears.


If people high in Blue values feared uncertainty more, that insight ties values to perceptions. Blue people may resist change more.


Or if Orange achievers feared failure most, that reveals their drive. They may overwork to avoid mistakes.


Comparing tests gives an expanded picture of values in action. More puzzle pieces make the whole image more apparent!


Multiple tests can work together, like colors blending on a palette. Other polls reveal what engages your values, like how your hobbies show what activities you enjoy most. Combined, they paint a richer picture of what motivates our thoughts and deeds.


Below you can read an abridged version of the results of our VUCA poll “Fears“. The full results of our VUCA poll “Fears“ are available for free in the FAQ section after login or registration.


Ótta.

Land
Tungumál
-
Mail
Endurreiknað
Það er tölfræðilega marktæk fylgni
Venjuleg dreifing, eftir William Sealy Gosset (námsmaður) r = 3.3
Ekki venjuleg dreifing, eftir Spearman r = 0.13
Skoðanakönnun
Allar spurningar
Allar spurningar
Mesta ótta mín er
Dreifing
Jákvæð fylgni,% Neikvæð fylgni,%
Venjulegt
-15.4
Answer 1
-9.4
Answer 2
-2
Answer 3
-9.8
Answer 4
-17.6
Answer 5
-3.1
Answer 6
-5.1
Answer 7
-13.6
Answer 8
-18.2
Answer 9
-13
Answer 10
-12
Answer 11
-15.2
Answer 12
-16
Answer 13
-11.7
Answer 14
-11.8
Answer 15
-7.1
Answer 16
Venjulegt
1.3
Answer 2
7.9
Answer 3
2.1
Answer 4
8.3
Answer 6
6.4
Answer 7
1.4
Answer 8
3.1
Answer 11
3
Answer 12
1.8
Answer 13
0.9
Answer 14
2.2
Answer 15
2.8
Answer 16
-1.3
Answer 1
-2
Answer 5
-5.2
Answer 9
-1.3
Answer 10
Venjulegt
3
Answer 1
4.5
Answer 2
4.7
Answer 3
3
Answer 4
1.9
Answer 6
4.7
Answer 7
3.4
Answer 8
3.4
Answer 10
2
Answer 11
2.5
Answer 12
4.2
Answer 13
6.5
Answer 16
-0.1
Answer 5
-1.3
Answer 9
-0.1
Answer 14
-1.6
Answer 15
Venjulegt
9.2
Answer 1
6.3
Answer 2
1.5
Answer 4
7.3
Answer 5
1.5
Answer 8
7
Answer 9
2.5
Answer 10
0.8
Answer 11
3.6
Answer 12
2.6
Answer 13
1.8
Answer 15
-4.6
Answer 3
-0.8
Answer 6
-2.4
Answer 7
-0.9
Answer 14
-4
Answer 16
Venjulegt
1.4
Answer 5
0.8
Answer 9
-1.6
Answer 1
-4.4
Answer 2
-4.1
Answer 3
-1.9
Answer 4
-6.3
Answer 6
-6.9
Answer 7
-3.3
Answer 8
-2.1
Answer 10
-0.9
Answer 11
-3.6
Answer 12
-4.4
Answer 13
-0.1
Answer 14
-4.3
Answer 15
-3.8
Answer 16
Ekki
eðlilegt
3.1
Answer 1
3.5
Answer 4
12.8
Answer 5
0.8
Answer 6
3.8
Answer 7
8.5
Answer 8
16.8
Answer 9
7.6
Answer 10
5.3
Answer 11
10.4
Answer 12
10.4
Answer 13
10.2
Answer 14
13.7
Answer 15
2.7
Answer 16
-0.1
Answer 2
-1.2
Answer 3
Ekki
eðlilegt
5.6
Answer 1
2.3
Answer 2
4.4
Answer 4
3
Answer 5
1.3
Answer 7
7
Answer 8
6.7
Answer 9
7.8
Answer 10
5.8
Answer 11
3.9
Answer 12
6.5
Answer 13
7.1
Answer 14
5.6
Answer 15
5.9
Answer 16
-0.3
Answer 3


Flytja út í MS Excel
Þessi virkni verður í boði í eigin VUCA kannanir þínar
Ok

2023.11.22
Valerii Kosenko
Vörueigandinn SaaS Pet Project SDTEST®

Valerii var hæfur sem félagslegur kennslufræðingur árið 1993 og hefur síðan beitt þekkingu sinni í verkefnastjórnun.
Valerii náði meistaragráðu og hæfi verkefnis og dagskrárstjórans árið 2013. Meðan á meistaranámi sínu stóð kynntist hann Project Roadmap (GPM Deutsche Gesellschaft Für Projektmanagement e. V.) og Spiral Dynamics.
Valerii tók ýmis spíralvirknipróf og notaði þekkingu sína og reynslu til að laga núverandi útgáfu af SDTEST.
Valerii er höfundur þess að kanna óvissu V.U.C.A. Hugtak sem notar spíralvirkni og stærðfræðilega tölfræði í sálfræði, meira en 20 alþjóðlegar skoðanakannanir.
Þessi færsla hefur 0 Athugasemdir
Svara
Hætta við svar
Skildu athugasemd þína
×
Þú finnur villu
Leggja til rétta útgáfu ÞITT
Sláið inn e-mail eins og óskað er
Senda
Hætta við
Bot
sdtest
1
Sæll! Leyfðu mér að spyrja þig, þekkir þú nú þegar spíralvirkni?