הספר מבוסס מבחן «Spiral Dynamics:
Mastering Values, Leadership, and
Change» (ISBN-13: 978-1405133562)
נותני חסות

The Tale of the Tall Oak

Once upon a time, there was a tiny oak tree sapling named Peety. Peety dreamed of growing up into a mighty oak tree. 


Each year, Peety grew a little bit taller. He stretched his branches toward the sun and felt his trunk thicken as he grew. 


Over many years, Peety grew from a sapling into a young tree and finally into a tall, mature oak! He was so tall that he could see over the whole forest.


Peety noticed that the other tall oak trees had thick trunks, too. His friend Paul reached high into the sky just like Peety. Paul's trunk was thick and sturdy at the base. 


The small saplings that were sprouting had skinny little trunks. But Peety knew that would change over time as they grew taller.


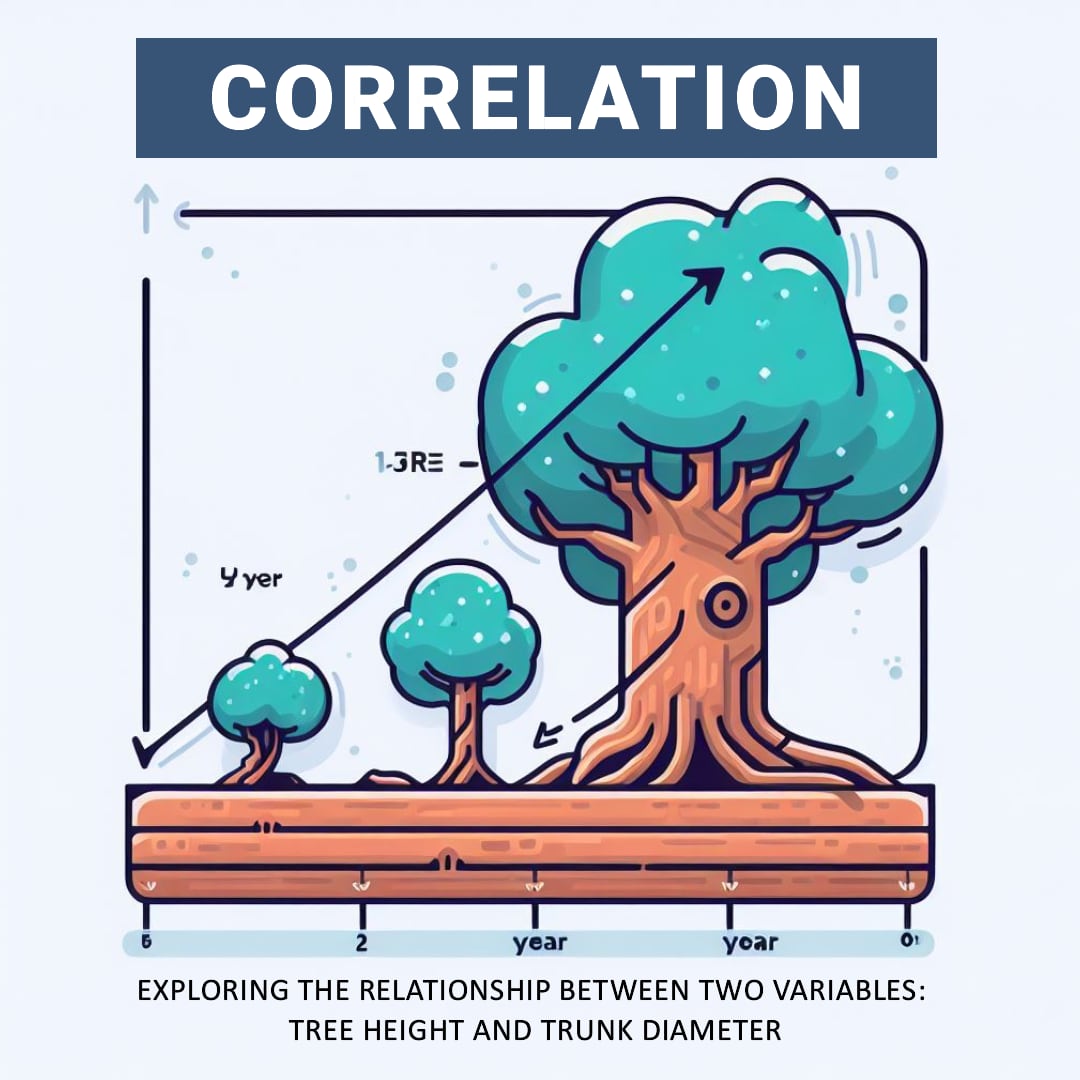
Peety realized that, just like him, the taller an oak tree was, the thicker its trunk became. 


So even though the forest was filled with all different sizes of oak trees, Peety noticed a pattern - a correlation between tree height and trunk width. The tall trees always had thicker trunks, while the small saplings had skinny trunks. This was how pine trees grew strong enough to reach great heights! 


If you record how a tree grows - its height and trunk thickness - and plot it on a picture or graph, then the correlation is when these two things change together. That is, if you see that one is increasing, the other is also increasing, and vice versa.


The SDTEST® gives clues to someone's motivational values. However, additional polls can provide more pieces of the puzzle.


Imagine also giving a "Fears" poll. It asks people to rate different fears from 0 (not scary) to 5 (very scary). 


Now imagine 100 people who took both tests. You could match up each person's SDTEST® colors with their rated fears.


If people high in Blue values feared uncertainty more, that insight ties values to perceptions. Blue people may resist change more.


Or if Orange achievers feared failure most, that reveals their drive. They may overwork to avoid mistakes.


Comparing tests gives an expanded picture of values in action. More puzzle pieces make the whole image more apparent!


Multiple tests can work together, like colors blending on a palette. Other polls reveal what engages your values, like how your hobbies show what activities you enjoy most. Combined, they paint a richer picture of what motivates our thoughts and deeds.


Below you can read an abridged version of the results of our VUCA poll “Fears“. The full results of our VUCA poll “Fears“ are available for free in the FAQ section after login or registration.


פחדים

מדינה
שפה
-
Mail
לחשב מחדש
קיים מתאם מובהק סטטיסטי
התפלגות רגילה, מאת ויליאם סיילי גוסט (סטודנט) r = 3.31
התפלגות לא נורמלית, מאת ספירמן r = 0.13
שאלות סקר
כל השאלות
כל השאלות
הפחד הגדול ביותר שלי הוא
הפצה
מתאם חיובי,% מתאם שלילי,%
נוֹרמָלִי
-15.4
Answer 1
-9.4
Answer 2
-2
Answer 3
-9.8
Answer 4
-17.5
Answer 5
-3.2
Answer 6
-5.1
Answer 7
-13.7
Answer 8
-18.1
Answer 9
-13
Answer 10
-12
Answer 11
-15.2
Answer 12
-16
Answer 13
-11.7
Answer 14
-11.8
Answer 15
-7.1
Answer 16
נוֹרמָלִי
1.2
Answer 2
7.9
Answer 3
2
Answer 4
8.3
Answer 6
6.4
Answer 7
1.3
Answer 8
3.2
Answer 11
2.9
Answer 12
1.7
Answer 13
0.8
Answer 14
2.2
Answer 15
2.8
Answer 16
-1.3
Answer 1
-2.1
Answer 5
-5.3
Answer 9
-1.5
Answer 10
נוֹרמָלִי
3
Answer 1
4.5
Answer 2
4.7
Answer 3
3
Answer 4
1.9
Answer 6
4.7
Answer 7
3.5
Answer 8
3.5
Answer 10
2
Answer 11
2.5
Answer 12
4.2
Answer 13
6.5
Answer 16
-0.1
Answer 5
-1.3
Answer 9
-0.1
Answer 14
-1.6
Answer 15
נוֹרמָלִי
9.1
Answer 1
6.5
Answer 2
1.5
Answer 4
7.3
Answer 5
1.5
Answer 8
6.9
Answer 9
2.3
Answer 10
0.8
Answer 11
3.6
Answer 12
2.7
Answer 13
1.8
Answer 15
-4.6
Answer 3
-0.8
Answer 6
-2.4
Answer 7
-0.9
Answer 14
-4
Answer 16
נוֹרמָלִי
1.4
Answer 5
0.9
Answer 9
-1.6
Answer 1
-4.6
Answer 2
-4.2
Answer 3
-1.8
Answer 4
-6.3
Answer 6
-6.9
Answer 7
-3.2
Answer 8
-1.8
Answer 10
-1
Answer 11
-3.5
Answer 12
-4.5
Answer 13
-0.1
Answer 14
-4.2
Answer 15
-3.9
Answer 16
לא
נורמלי
3.2
Answer 1
3.5
Answer 4
12.8
Answer 5
0.8
Answer 6
3.8
Answer 7
8.5
Answer 8
16.7
Answer 9
7.6
Answer 10
5.2
Answer 11
10.4
Answer 12
10.6
Answer 13
10.3
Answer 14
13.8
Answer 15
2.7
Answer 16
-1.1
Answer 3
לא
נורמלי
5.6
Answer 1
2.2
Answer 2
4.4
Answer 4
3
Answer 5
1.2
Answer 7
7
Answer 8
6.7
Answer 9
7.8
Answer 10
5.8
Answer 11
3.8
Answer 12
6.4
Answer 13
7.2
Answer 14
5.5
Answer 15
5.9
Answer 16
-0.4
Answer 3


יצוא ל- MS Excel
פונקציונליות זו תהיה זמינה בסקרי VUCA שלך
בסדר

2023.11.22
Valerii Kosenko
בעל מוצר SaaS PREST PREST SDTEST®

Valerii היה מוסמך כפסיכולוג פדגוג חברתי בשנת 1993 ומאז יישם את הידע שלו בניהול פרויקטים.
Valerii השיג תואר שני ואת ההסמכה של פרויקט ומנהל התוכנית בשנת 2013. במהלך תוכנית התואר השני שלו, הוא התוודע לפרויקט Roadmap (GPM Deutsche Gesellschaft Für Projektmananagement E. V.) ודינמיקה ספירלית.
Valerii לקח בדיקות דינמיקות ספירליות שונות והשתמש בידע ובניסיון שלו כדי להתאים את הגרסה הנוכחית של SDTEST.
Valerii הוא המחבר של בחינת חוסר הוודאות של ה- V.U.C.A. מושג באמצעות דינמיקה ספירלית וסטטיסטיקה מתמטית בפסיכולוגיה, יותר מ 20 סקרים בינלאומיים.
לפוסט הזה יש 0 הערות
להגיב ל
בטל תשובה
השאר את התגובה שלך
×
אתה מוצא שגיאה
להציע את הגרסה שלך נכון
זן הדואר האלקטרוני שלך כרצונך
לִשְׁלוֹחַ
לְבַטֵל
Bot
sdtest
1
שלום שם! תן לי לשאול אותך, האם אתה כבר מכיר את הדינמיקה הספירלית?