VUCA conditions are increasingly characteristic of today's tumultuous business environment. This article examines the application of Spiral Dynamics in understanding volatility, uncertainty, complexity, and ambiguity (VUCA) through statistical correlations. This research aimed to uncover insights into navigating turbulence by exploring linkages between VUCA perceptions and human value systems. A sample "Fears" poll demonstrated the methodology, revealing correlations like higher anxiety towards ambiguity among traditionalist groups. The findings enabled tailored interventions across culture shaping, workforce segmentation, change management, and leadership development within organizational contexts. This approach provides enhanced granularity, predictive capability, and psychological perspective compared to traditional methods. Overall, integrating developmental models with data analysis offers a novel way to uncover human motivations, enabling organizations to embrace volatility as an opportunity.
This research pursues a new interdisciplinary understanding of VUCA turbulence by integrating rigorous data analysis with psychological models to uncover new insights on navigating an increasingly volatile, uncertain, complex, and ambiguous world by exploring linkages between turbulence perceptions and human value systems. Quantitatively correlating perceptions of VUCA conditions with Spiral Dynamics psychological models can reveal how different mindsets perceive and react to turbulence. These empirical insights are invaluable for organizations seeking to adapt strategic planning, communication, and change management initiatives to succeed in chaotic environments.
Understanding correlations between VUCA elements and the value spectra of Spiral stages aids in anticipating challenges and resistance. These empirical insights propel more nimble navigation of VUCA’s challenges. It enables targeted mitigation strategies customized to the motivations of each mindset.
In today's dynamic and rapidly changing world, the concept of VUCA (Volatility, Uncertainty, Complexity, and Ambiguity) has gained substantial importance.
The VUCA framework originated in the late 1980s from the U.S. Army War College to describe the volatile, uncertain, complex, and ambiguous multilateral world emerging after the Cold War. The concept has since gained wider applicability for leaders and organizations operating in turbulent environments (Bennett & Lemoine, 2014).
Some several methods and tools can be used to measure Volatility, Uncertainty, Complexity, and Ambiguity:
| Volatility | Uncertainty | Complexity | Ambiguity |
| Audit and Compliance Metrics | |||
| Benchmarking | |||
| Coefficient of Variation | Confidence Intervals | Cognitive Load Metrics | Causal Ambiguity |
| Decision Tree Analysis | Control Assessments | ||
| Expert Judgment | Expert Judgment | ||
| GARCH Models | Factor Analysis | ||
| Monte Carlo Simulations | Media Framing Analysis | ||
| Network Analysis | Number of Interpretations | ||
| Organizational Layer Analysis | Observational Studies | ||
| Prediction Markets | Process Mapping | ||
| Process Mining | Process Mining | Process Mining | |
| Questionnaire Batteries | |||
| Risk Identification | Risk Analysis Frameworks | Risk Identification | |
| Rolling Standard Deviation | Real Options Analysis | ||
| Sentiment Analysis | Sentiment Analysis | Simulation Models | Sentiment Analysis |
| Statistical Process Control (SPC) Charts | Scenario Planning | Statistical Complexity | |
| Sensitivity Analysis | |||
| Survey Analysis | Survey Analysis | Survey Analysis | |
| Variety Analysis | Text Analysis |
The right approach depends on the context and type of ambiguity. A combination of data analysis, expert input, surveys, media monitoring and process visualization provides a comprehensive view of ambiguity.
VUCA represents the challenging environment characterized by constant volatility, unpredictable uncertainties, intricate complexities, and elusive ambiguities. Understanding VUCA and its impact on organizations and businesses is crucial for their survival and success in such an environment.
The "V.U.C.A. POLL DESIGNER" tool is an innovative solution designed to track and address VUCA elements through statistical correlations with Spiral Dynamics color models. Spiral Dynamics is a psychological model that identifies distinct stages of human development, each represented by a specific color code. By integrating VUCA and Spiral Dynamics, we can gain valuable insights into how different color-coded value systems respond to VUCA elements.
This article aims to explore the relationship between VUCA and Spiral Dynamics through statistical correlations, demonstrating the potential of the "V.U.C.A. POLL DESIGNER" tool in providing a deeper understanding of VUCA elements and their implications. For instance, a specific 'Fears' poll created with the tool will be analyzed in depth through real-life examples in the following sections, demonstrating the practical application of the methodology.
The "Fears" poll provides a real-world example of how the "V.U.C.A. POLL DESIGNER" tool can generate customized questionnaires to gather data on perceptions of volatility, uncertainty, complexity, and ambiguity. This poll focuses on the psychological dimension of fears and anxieties related to VUCA conditions. By correlating responses on fear levels with Spiral Dynamics stages, the tool reveals insights into how different mindsets perceive and react to turbulent environments. The poll showcases the tool's versatility in tailoring questionnaires to measure VUCA elements and derive organizationally relevant psychographic correlations. The "Fears" example demonstrates a practical application of the tool for a specific volatility-related perception - anxieties and trepidations evoked by turbulence.
The "V.U.C.A. POLL DESIGNER" tool is versatile and can be used to measure all four VUCA dimensions. It combines qualitative and quantitative methods, allowing for a more comprehensive view of the VUCA environment. The tool can be used to collect data from a variety of sources, including surveys, interviews, and social media. The data is then analyzed to identify patterns and trends to help organizations understand the VUCA environment and make better decisions.
Here is a table matching the "V.U.C.A. POLL DESIGNER" tool to relevant methods for measuring volatility, uncertainty, complexity, and ambiguity:
| VUCA Dimension | Relevant Measurement Methods | Application via "V.U.C.A. POLL DESIGNER" | Value of Correlating with Spiral Dynamics Models |
| Volatility | Statistical Process Control (SPC) Charts, Coefficient of Variation, Rolling Standard Deviation | The tool can create polls asking respondents to rate perceived volatility over time on a numeric scale. Statistical analysis techniques like control charts and rolling standard deviation can then quantify volatility trends and fluctuations from the longitudinal poll data. | Correlations reveal which Spiral mindsets associate volatility with opportunity or threat. |
| Uncertainty | Monte Carlo Simulations, Prediction Markets, Confidence Intervals | The tool enables designing polls that ask respondents to estimate probabilities of potential outcomes. Monte Carlo simulation can then be run on the aggregate predictions to model likelihood distributions and assess overall uncertainty. | Correlations show which mindsets are more/less comfortable with uncertainty. |
| Complexity | Network Analysis, Process Mapping, Variety Analysis | Polls can be built to map relationships between people, teams, and processes. Respondents identify connections that can be analyzed as networks to measure complexity. | Correlations identify mindsets that can cognitively handle complexity. |
| Ambiguity | Sentiment Analysis, Questionnaire Batteries, Causal Ambiguity | Carefully designed polls with open-ended questions can reveal ambiguous, vague or uncertain language via text analysis. Questionnaires can assess tolerance for ambiguity via contradictory or unclear questions. Polls can also gather data to analyze perceptions of causal ambiguity in systems. | Correlations determine mindsets that perceive and tolerate more ambiguity. |
In summary:
Dr. Clare W. Graves was an American psychology professor who conducted decades of research starting in the 1950s on human nature, motivation, and developmental psychology. His pioneering work focused on identifying different levels of psychological existence that humans progress through as they cope with an increasingly complex world.
Graves utilized mathematical analysis and statistical tools extensively in his empirical research methodology. Over several decades, he administered numerous questionnaires and personality assessments to thousands of subjects. Graves then performed a detailed statistical analysis on this data, calculating correlations and distributions to uncover patterns and relationships between human values, motivations, and behaviors.
His research uncovered a recurring theme – the emergence of hierarchical systems of psychological coping mechanisms as humans deal with growing complexities. Through factor analysis and other mathematical techniques, Graves identified clusters of value systems that formed a coherent progression of levels of existence.
This formed the basis for his seminal theory of levels of psychological existence, which later evolved into Spiral Dynamics. The theory describes an emergent, open-ended spiral of value systems, worldviews, and mindsets humans move through as conditions change.
Graves' pioneering empirical work integrating mathematical analysis into psychological research provided the foundation for the Spiral Dynamics framework. The quantitative methodology and data-driven insights were critical in substantiating the stages of development in his human nature theory.
In his seminal 1970 article, Graves provides extensive detail on utilizing factor analysis to identify value clusters from questionnaires of over 4,000 subjects. This formed coherent stages of coping mechanisms that were further developed into his theory on levels of psychological existence.
Leveraging statistical techniques, Graves assessed over 10,000 diverse subjects from the 1950s-1980s to uncover generalized insights on human development trends. The large and varied sample increased the result's credibility. Regression analysis quantified relationships between value systems and life conditions.
The proposed correlation analysis between VUCA perceptions and Spiral stages closely mirrors Graves' rigorous empirical approach. Graves' original theory and the VUCA polling data outlined in this article are fundamentally quantitative. Performing statistical correlation analysis links the current research nicely with Graves' pioneering work applying mathematical techniques to advance human psychological theory. Citing specific published studies by Graves, like his seminal 1970 article, highlights the consistent quantitative orientation and bolsters scholarly rigor.
This article on applying Spiral Dynamics to understand VUCA aligns closely with Dr. Graves' interdisciplinary approach of employing statistical tools and mathematical analysis to uncover core insights about the progression of human psychology and values. The proposed correlation analysis builds nicely upon Graves' legacy.
This research employed statistical correlations to uncover relationships between poll responses created with the "V.U.C.A. POLL DESIGNER" tool and the Spiral Dynamics color models.
Correlation Analysis: Correlation analysis is a statistical method used to examine the relationships between variables. Correlation measures the strength and direction of the linear relationship between two or more variables. It helps identify patterns, trends, and associations within the data.
Correlation Coefficient: The correlation coefficient, often denoted by "r," quantifies the strength and direction of the correlation. It ranges between -1 to 1, where -1 represents a perfect negative correlation, 1 indicates a perfect positive correlation, and 0 signifies no correlation. Positive correlations imply that variables move in the same direction, while negative correlations indicate that they move in opposite directions.
Statistical Significance: Determining the statistical significance of correlations is essential to differentiate meaningful relationships from chance occurrences. Critical correlation values can be used to assess whether the correlation coefficient is significantly different from zero.
The "V.U.C.A. POLL DESIGNER" tool created customized polls to gather data on volatility, uncertainty, complexity, and ambiguity perceptions. The poll responses were statistically analyzed to calculate correlation coefficients between the results and corresponding Spiral Dynamics color models.
Correlation dependence measures how changes in one variable (Spiral stage) impact the probability distribution of the other (VUCA perception). The correlation coefficients and critical values determined whether the identified relationships were statistically significant.
While statistical analysis of the poll data provides quantitative measures of VUCA perceptions, correlating the results with Spiral Dynamics stages offers additional psychographic context.
Spiral Dynamics is a conceptual model developed by Clare Graves that frames human development in terms of an emergent, nested hierarchy of value systems (Beck & Cowan, 1996). These value systems or stages are color-coded, with higher stages indicating greater adaptability and cognitive complexity.
Analyzing correlations between perceptions of volatility, uncertainty, complexity, and ambiguity and the different Spiral stages provides insights into how people at varying levels of psychological development view these VUCA factors.
For instance, the authoritarian Blue stage is rules-driven and averse to ambiguity and change, while the flexible Yellow stage is comfortable with uncertainty and thriving in complexity (Anderson & Adams, 2016).
By uncovering these correlations, organizations can better understand motivations, adapt communications appropriately, and predict reactions to change initiatives for people at different Spiral stages.
Thus, correlating poll-based VUCA metrics with Spiral Dynamics models enriches the analysis significantly. The synergistic application of these approaches provides both quantitative rigor and psychological depth to studying turbulence perception.
This rigorous quantitative methodology provided an empirical means to examine the linkages between human value systems and perceptions of turbulent VUCA conditions. The statistically significant correlations offer data-driven insights for organizations to navigate VUCA environments more effectively.
The "Fears" poll provides an exemplary demonstration of the quantitative correlation methodology outlined in this research. The poll was created using the V.U.C.A. POLL DESIGNER tool to gather perception data on a volatility-related aspect – turbulence-related anxieties.
Respondents assessed the importance of various fears, providing numerical ratings. This perceptual data was statistically analyzed to determine correlation coefficients between fear levels and Spiral Dynamics stages. Higher positive coefficients imply a greater association between a particular stage and fear.
These quantitative correlations were tested for statistical significance to ensure credibility and generalizability. The "Fears" poll exemplifies the methodology of using tailored questionnaires to obtain VUCA perception data, analyzing stage correlations, and deriving psychographic insights to inform organizational strategy.
The poll's focus on volatility-related fears also directly aligns with the overarching aim of quantitatively investigating relationships between VUCA elements and human developmental psychology. Thus, the “Fears” poll provides an applied example underscoring the conceptual research methodology.
The poll was designed as a voluntary participation scheme, where site visitors can decide whether to participate. This approach ensures the respondents willingly provide their insights and experiences regarding their fears.
The type of question in this one-question poll is a multiple-choice, multiple-selection question with a 5-point rating scale for each selected option.
Respondents are asked to complete the statement "My greatest fears are" and are presented with a fixed list of options from which they can choose any number of options that apply to them. Each selected option is then asked to rate its importance or intensity using a 5-point scale, where 5 represents the highest level of fear or importance, and 1 represents the lowest level.
The poll allows respondents to choose from a predetermined set of fears and provides a rating scale to capture each fear's relative importance or intensity. This format enables researchers to gather data on the frequency of various fears and the strength of these fears among respondents.
The poll is accessible to individuals visiting the SDTEST website. Participants are not explicitly targeted or pre-selected; the poll is open to all interested individuals who voluntarily participated. This approach allows for a diverse pool of respondents, including perspectives from various industries, sectors, and geographic locations.
The poll is available all over the world where the Internet is available, and it has already been completed in 93 countries in 18 different languages.
Data collection started in May 2022 and is ongoing so that participants can fill out the questionnaire at a convenient time for them. The data collected from the poll responses formed the basis of the subsequent analysis and study of the correlation between reported fears and behaviors, indicated by the colors of Spiral Dynamics.
In summary, the poll design encompasses a voluntary participation scheme, carefully constructed poll question with response options representing various fears, and a broad participant selection. These elements ensure the collection of comprehensive and diverse data that would facilitate a robust analysis of fears.
The number of participants who voluntarily participated in the poll is constantly increasing, but already no less than 2’000 participants. These participants provided valuable insights. The robustness of the dataset, with a considerable number of participants, enhances the reliability and generalizability of the study findings.
The sample consists of individuals from diverse backgrounds, already representing 93 countries and encompassing various industries, sectors, and organizational settings. This diversity ensures that the dataset captures a wide array of fears.
The sample also includes participants who are fluent in 18 different languages. This linguistic diversity reflects the global reach of the study and enables the exploration of variations in company actions across different linguistic contexts.
While efforts were made to obtain a representative sample across countries and languages, the poll's findings may only be partially generalizable to some companies or industries globally. The sample composition, although diverse, may still exhibit certain biases inherent to voluntary participation and online poll methods. However, steps were taken to mitigate such biases and ensure a broad representation of perspectives and experiences.
Including a substantial number of participants and the broad geographical and linguistic coverage contributes to the comprehensiveness and richness of the dataset, allowing for meaningful analysis and exploration of fears.
To illustrate the practical application of the "V.U.C.A. POLL DESIGNER" tool, real-life examples are presented. For instance, the "Fears” poll explores how different color-coded value systems respond to various fears in a VUCA environment. The statistical correlations derived from the poll data can provide valuable insights into the prevalence of VUCA elements in different scenarios.
What color are you Spiral Dynamics?
| Color | In a life | In a business |
| Turquoise | The Global vision | Synthesis |
| Yellow | Flexible stream | Win-Win-Win behaviour |
| Green | Interpersonal relations | Social networks |
| Orange | Competition | Project management |
| Blue | The power of truth | Business Process Management |
| Red | The rule of force | Starting up a personal business |
| Purple | Family relations | Family relations |
| Beige | Survival | Own farm |
| விநியோகம் | இயல்பானதுஅல்ல | இயல்பானதுஅல்ல | இயல்பானதுஅல்ல | சாதாரண | சாதாரண | சாதாரண | சாதாரண | சாதாரண |
|
அனைத்து கேள்விகளும்
அனைத்து கேள்விகளும்
என் மிகப்பெரிய பயம்
| ||||||||
| என் மிகப்பெரிய பயம் | ||||||||
| Answer 1 | - | பலவீனமான நேர்மறை 0.0543 | பலவீனமான நேர்மறை 0.0280 | பலவீனமான எதிர்மறை -0.0178 | பலவீனமான நேர்மறை 0.0950 | பலவீனமான நேர்மறை 0.0369 | பலவீனமான எதிர்மறை -0.0176 | பலவீனமான எதிர்மறை -0.1552 |
| Answer 2 | - | பலவீனமான நேர்மறை 0.0199 | பலவீனமான எதிர்மறை -0.0053 | பலவீனமான எதிர்மறை -0.0391 | பலவீனமான நேர்மறை 0.0659 | பலவீனமான நேர்மறை 0.0496 | பலவீனமான நேர்மறை 0.0106 | பலவீனமான எதிர்மறை -0.0982 |
| Answer 3 | - | பலவீனமான எதிர்மறை -0.0009 | பலவீனமான எதிர்மறை -0.0093 | பலவீனமான எதிர்மறை -0.0442 | பலவீனமான எதிர்மறை -0.0441 | பலவீனமான நேர்மறை 0.0485 | பலவீனமான நேர்மறை 0.0749 | பலவீனமான எதிர்மறை -0.0211 |
| Answer 4 | - | பலவீனமான நேர்மறை 0.0436 | பலவீனமான நேர்மறை 0.0280 | பலவீனமான எதிர்மறை -0.0230 | பலவீனமான நேர்மறை 0.0164 | பலவீனமான நேர்மறை 0.0359 | பலவீனமான நேர்மறை 0.0227 | பலவீனமான எதிர்மறை -0.0987 |
| Answer 5 | - | பலவீனமான நேர்மறை 0.0272 | பலவீனமான நேர்மறை 0.1292 | பலவீனமான நேர்மறை 0.0110 | பலவீனமான நேர்மறை 0.0757 | பலவீனமான நேர்மறை 0.0005 | பலவீனமான எதிர்மறை -0.0175 | பலவீனமான எதிர்மறை -0.1789 |
| Answer 6 | - | பலவீனமான எதிர்மறை -0.0017 | பலவீனமான நேர்மறை 0.0052 | பலவீனமான எதிர்மறை -0.0611 | பலவீனமான எதிர்மறை -0.0092 | பலவீனமான நேர்மறை 0.0251 | பலவீனமான நேர்மறை 0.0849 | பலவீனமான எதிர்மறை -0.0358 |
| Answer 7 | - | பலவீனமான நேர்மறை 0.0111 | பலவீனமான நேர்மறை 0.0343 | பலவீனமான எதிர்மறை -0.0654 | பலவீனமான எதிர்மறை -0.0308 | பலவீனமான நேர்மறை 0.0530 | பலவீனமான நேர்மறை 0.0682 | பலவீனமான எதிர்மறை -0.0533 |
| Answer 8 | - | பலவீனமான நேர்மறை 0.0643 | பலவீனமான நேர்மறை 0.0727 | பலவீனமான எதிர்மறை -0.0262 | பலவீனமான நேர்மறை 0.0140 | பலவீனமான நேர்மறை 0.0383 | பலவீனமான நேர்மறை 0.0157 | பலவீனமான எதிர்மறை -0.1346 |
| Answer 9 | - | பலவீனமான நேர்மறை 0.0741 | பலவீனமான நேர்மறை 0.1606 | பலவீனமான நேர்மறை 0.0062 | பலவீனமான நேர்மறை 0.0631 | பலவீனமான எதிர்மறை -0.0075 | பலவீனமான எதிர்மறை -0.0489 | பலவீனமான எதிர்மறை -0.1820 |
| Answer 10 | - | பலவீனமான நேர்மறை 0.0764 | பலவீனமான நேர்மறை 0.0669 | பலவீனமான எதிர்மறை -0.0131 | பலவீனமான நேர்மறை 0.0282 | பலவீனமான நேர்மறை 0.0356 | பலவீனமான எதிர்மறை -0.0132 | பலவீனமான எதிர்மறை -0.1342 |
| Answer 11 | - | பலவீனமான நேர்மறை 0.0633 | பலவீனமான நேர்மறை 0.0525 | பலவீனமான எதிர்மறை -0.0082 | பலவீனமான நேர்மறை 0.0104 | பலவீனமான நேர்மறை 0.0256 | பலவீனமான நேர்மறை 0.0240 | பலவீனமான எதிர்மறை -0.1263 |
| Answer 12 | - | பலவீனமான நேர்மறை 0.0451 | பலவீனமான நேர்மறை 0.0948 | பலவீனமான எதிர்மறை -0.0330 | பலவீனமான நேர்மறை 0.0320 | பலவீனமான நேர்மறை 0.0334 | பலவீனமான நேர்மறை 0.0258 | பலவீனமான எதிர்மறை -0.1532 |
| Answer 13 | - | பலவீனமான நேர்மறை 0.0721 | பலவீனமான நேர்மறை 0.0956 | பலவீனமான எதிர்மறை -0.0389 | பலவீனமான நேர்மறை 0.0275 | பலவீனமான நேர்மறை 0.0428 | பலவீனமான நேர்மறை 0.0145 | பலவீனமான எதிர்மறை -0.1630 |
| Answer 14 | - | பலவீனமான நேர்மறை 0.0800 | பலவீனமான நேர்மறை 0.0908 | பலவீனமான எதிர்மறை -0.0024 | பலவீனமான எதிர்மறை -0.0108 | பலவீனமான நேர்மறை 0.0059 | பலவீனமான நேர்மறை 0.0133 | பலவீனமான எதிர்மறை -0.1225 |
| Answer 15 | - | பலவீனமான நேர்மறை 0.0550 | பலவீனமான நேர்மறை 0.1274 | பலவீனமான எதிர்மறை -0.0340 | பலவீனமான நேர்மறை 0.0120 | பலவீனமான எதிர்மறை -0.0152 | பலவீனமான நேர்மறை 0.0238 | பலவீனமான எதிர்மறை -0.1156 |
| Answer 16 | - | பலவீனமான நேர்மறை 0.0726 | பலவீனமான நேர்மறை 0.0245 | பலவீனமான எதிர்மறை -0.0368 | பலவீனமான எதிர்மறை -0.0400 | பலவீனமான நேர்மறை 0.0726 | பலவீனமான நேர்மறை 0.0165 | பலவீனமான எதிர்மறை -0.0769 |

| Distribution | Non Normal | Normal | Non-Normal | Normal | Normal | Normal | Normal | Normal |
| FEARS / Spiral Dynamics colors | Beige | Purple | Red | Blue | Orange | Green | Yellow | Turquoise |
| Illness of relatives, children | - | 0,0093 | 0,0072 | 0,0032 |  0,1085 0,1085 | 0,0177 | 0,0183 |  -0,1559 -0,1559 |
| World War | - | 0,0161 | 0,0051 | -0,0232 |  0,0794 0,0794 | 0,0131 | 0,0134 |  -0,0986 -0,0986 |
| Arbitrary rule of the authorities | - | 0,0022 | -0,0149 |  -0,0567 -0,0567 | -0,0298 |  0,0541 0,0541 |  0,0904 0,0904 | -0,0414 |
| Illness | - | 0,0209 | 0,019 | -0,0075 | 0,0326 | 0,0172 | 0,0219 |  -0,0876 -0,0876 |
| Poverty | - | 0,0097 | 0,1041 | 0,0168 |  0,0957 0,0957 | -0,0142 | 0,0031 |  -0,1805 -0,1805 |
| Return to repression | - | 0,0017 | -0,0042 |  -0,0524 -0,0524 | -0,0068 | 0,0102 |  0,0918 0,0918 | -0,0347 |
| Tougher regimes | - | 0,0246 | 0,0242 | -0,0365 | -0,0247 | 0,029 |  0,0739 0,0739 |  -0,0674 -0,0674 |
| Assault by criminals | - |  0,0667 0,0667 | 0,0672 | -0,0172 | 0,0303 | 0,0151 | 0,0213 |  -0,1392 -0,1392 |
| HIV/AIDS | - | 0,0304 | 0,1477 | 0,0292 |  0,0958 0,0958 | -0,0412 |  -0,0451 -0,0451 |  -0,1699 -0,1699 |
| Deaths | - |  0,0834 0,0834 | 0,0887 | -0,0103 |  0,0446 0,0446 | 0,0041 | -0,0202 |  -0,1444 -0,1444 |
| Disasters | - | 0,0384 | 0,0332 | 0,0174 | 0,0132 | 0,0004 | 0,0427 |  -0,1167 -0,1167 |
| Loss of savings | - | 0,027 | 0,0973 | -0,018 |  0,0467 0,0467 | 0,008 | 0,0349 |  -0,1566 -0,1566 |
| Loss of job | - |  0,0501 0,0501 | 0,0923 | -0,03 |  0,045 0,045 | 0,018 | 0,0189 |  -0,1526 -0,1526 |
| Public humiliation | - |  0,0483 0,0483 | 0,104 | 0,0235 | 0,0211 | -0,0392 | 0,0014 |  -0,1126 -0,1126 |
| Old age | - |  0,0501 0,0501 | 0,1259 | -0,0271 | 0,0379 | -0,0062 | 0,0215 |  -0,1486 -0,1486 |
| COVID-19 | - |  0,047 0,047 | 0,0134 | -0,0163 | -0,0422 |  0,0515 0,0515 | 0,0402 |  -0,0696 -0,0696 |
Understanding VUCA is critical for organizations to navigate the complex and ever-changing landscape. The correlations obtained through the "V.U.C.A. POLL DESIGNER" tool can help organizations identify vulnerable areas and anticipate challenges. Correlation insights can inform decision-making processes and strategic planning, enabling organizations to adapt and thrive in a VUCA environment.
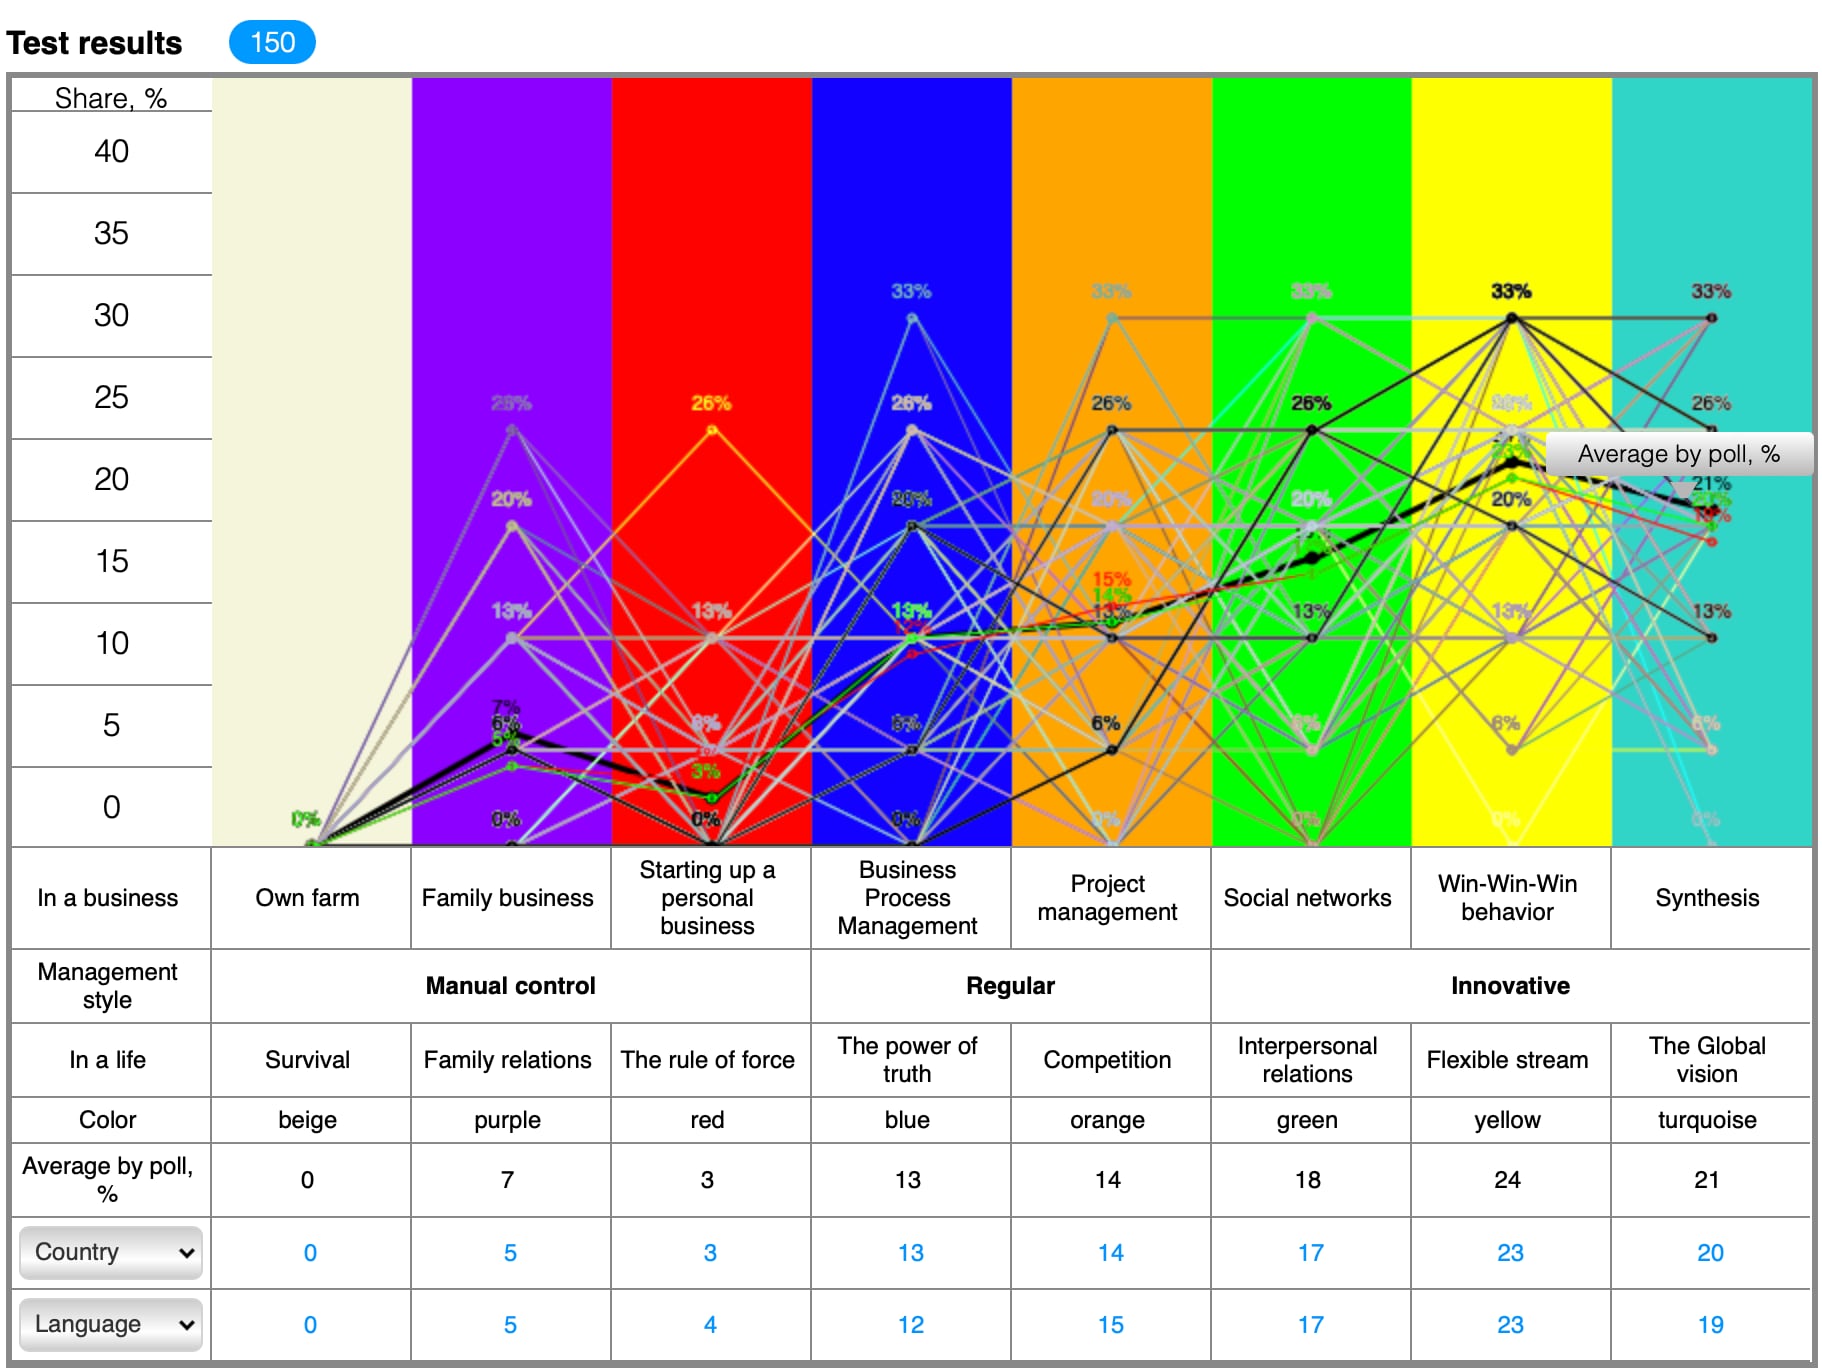
Below is the chart that displays these 150 respondents' responses to the SDTEST by colors of the Spiral Dynamics. This factual data is used to calculate the correlation with the ratings of fears (0-5) that respondents indicate in their answers.
The Country filter is the USA and shows the average SDTEST result for the USA from the full database. The Language filter is English and shows the average SDTEST result for English from the full database.
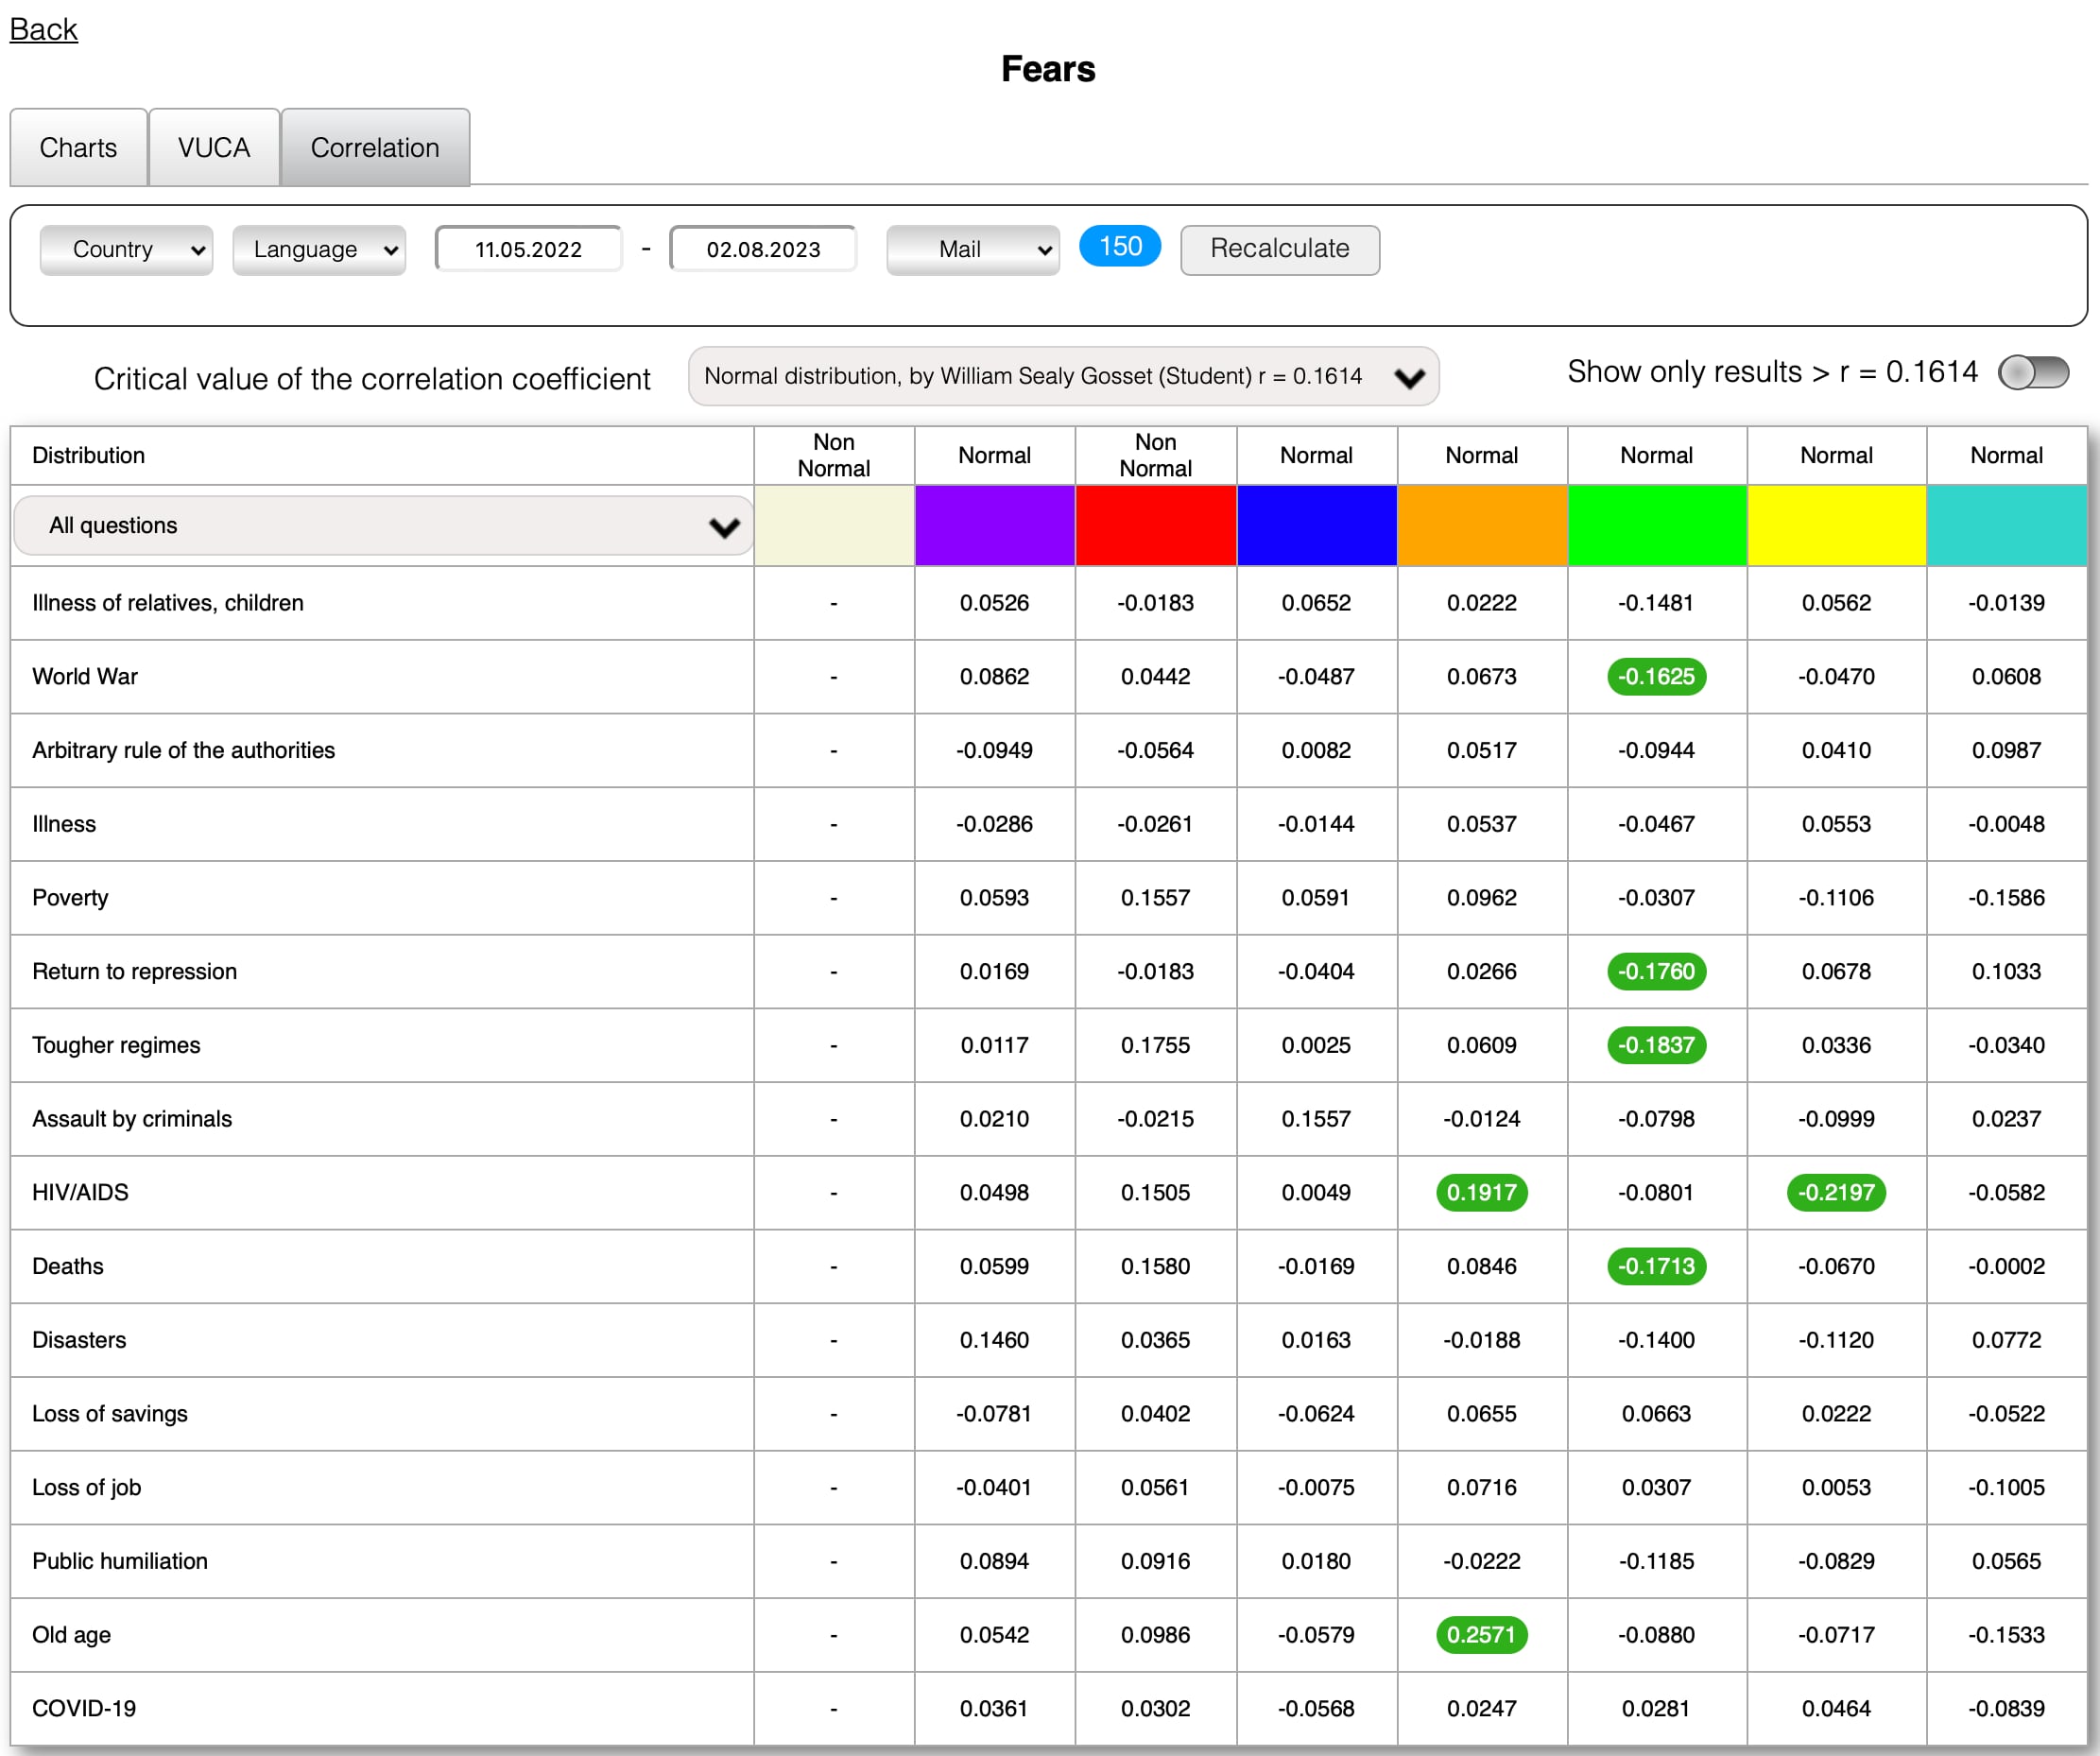
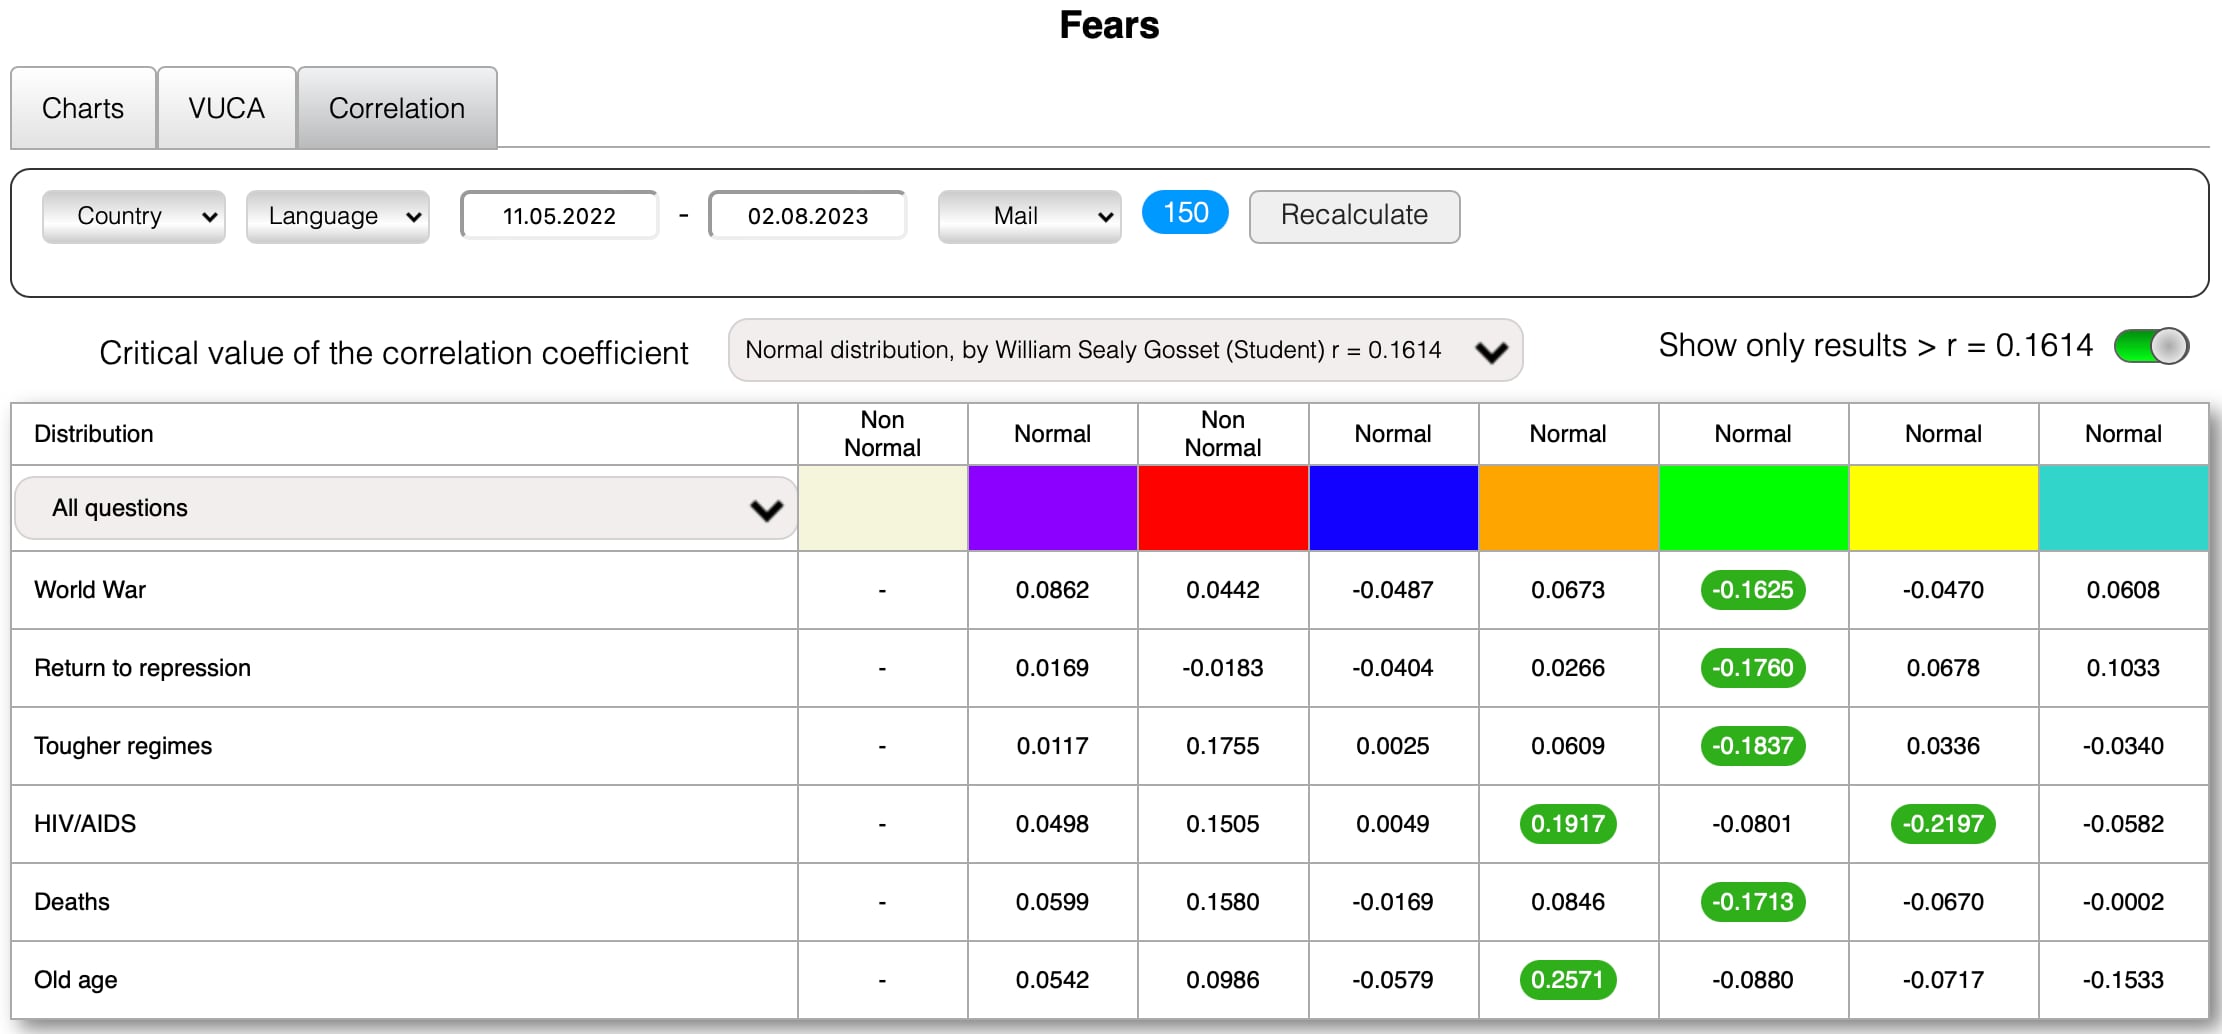
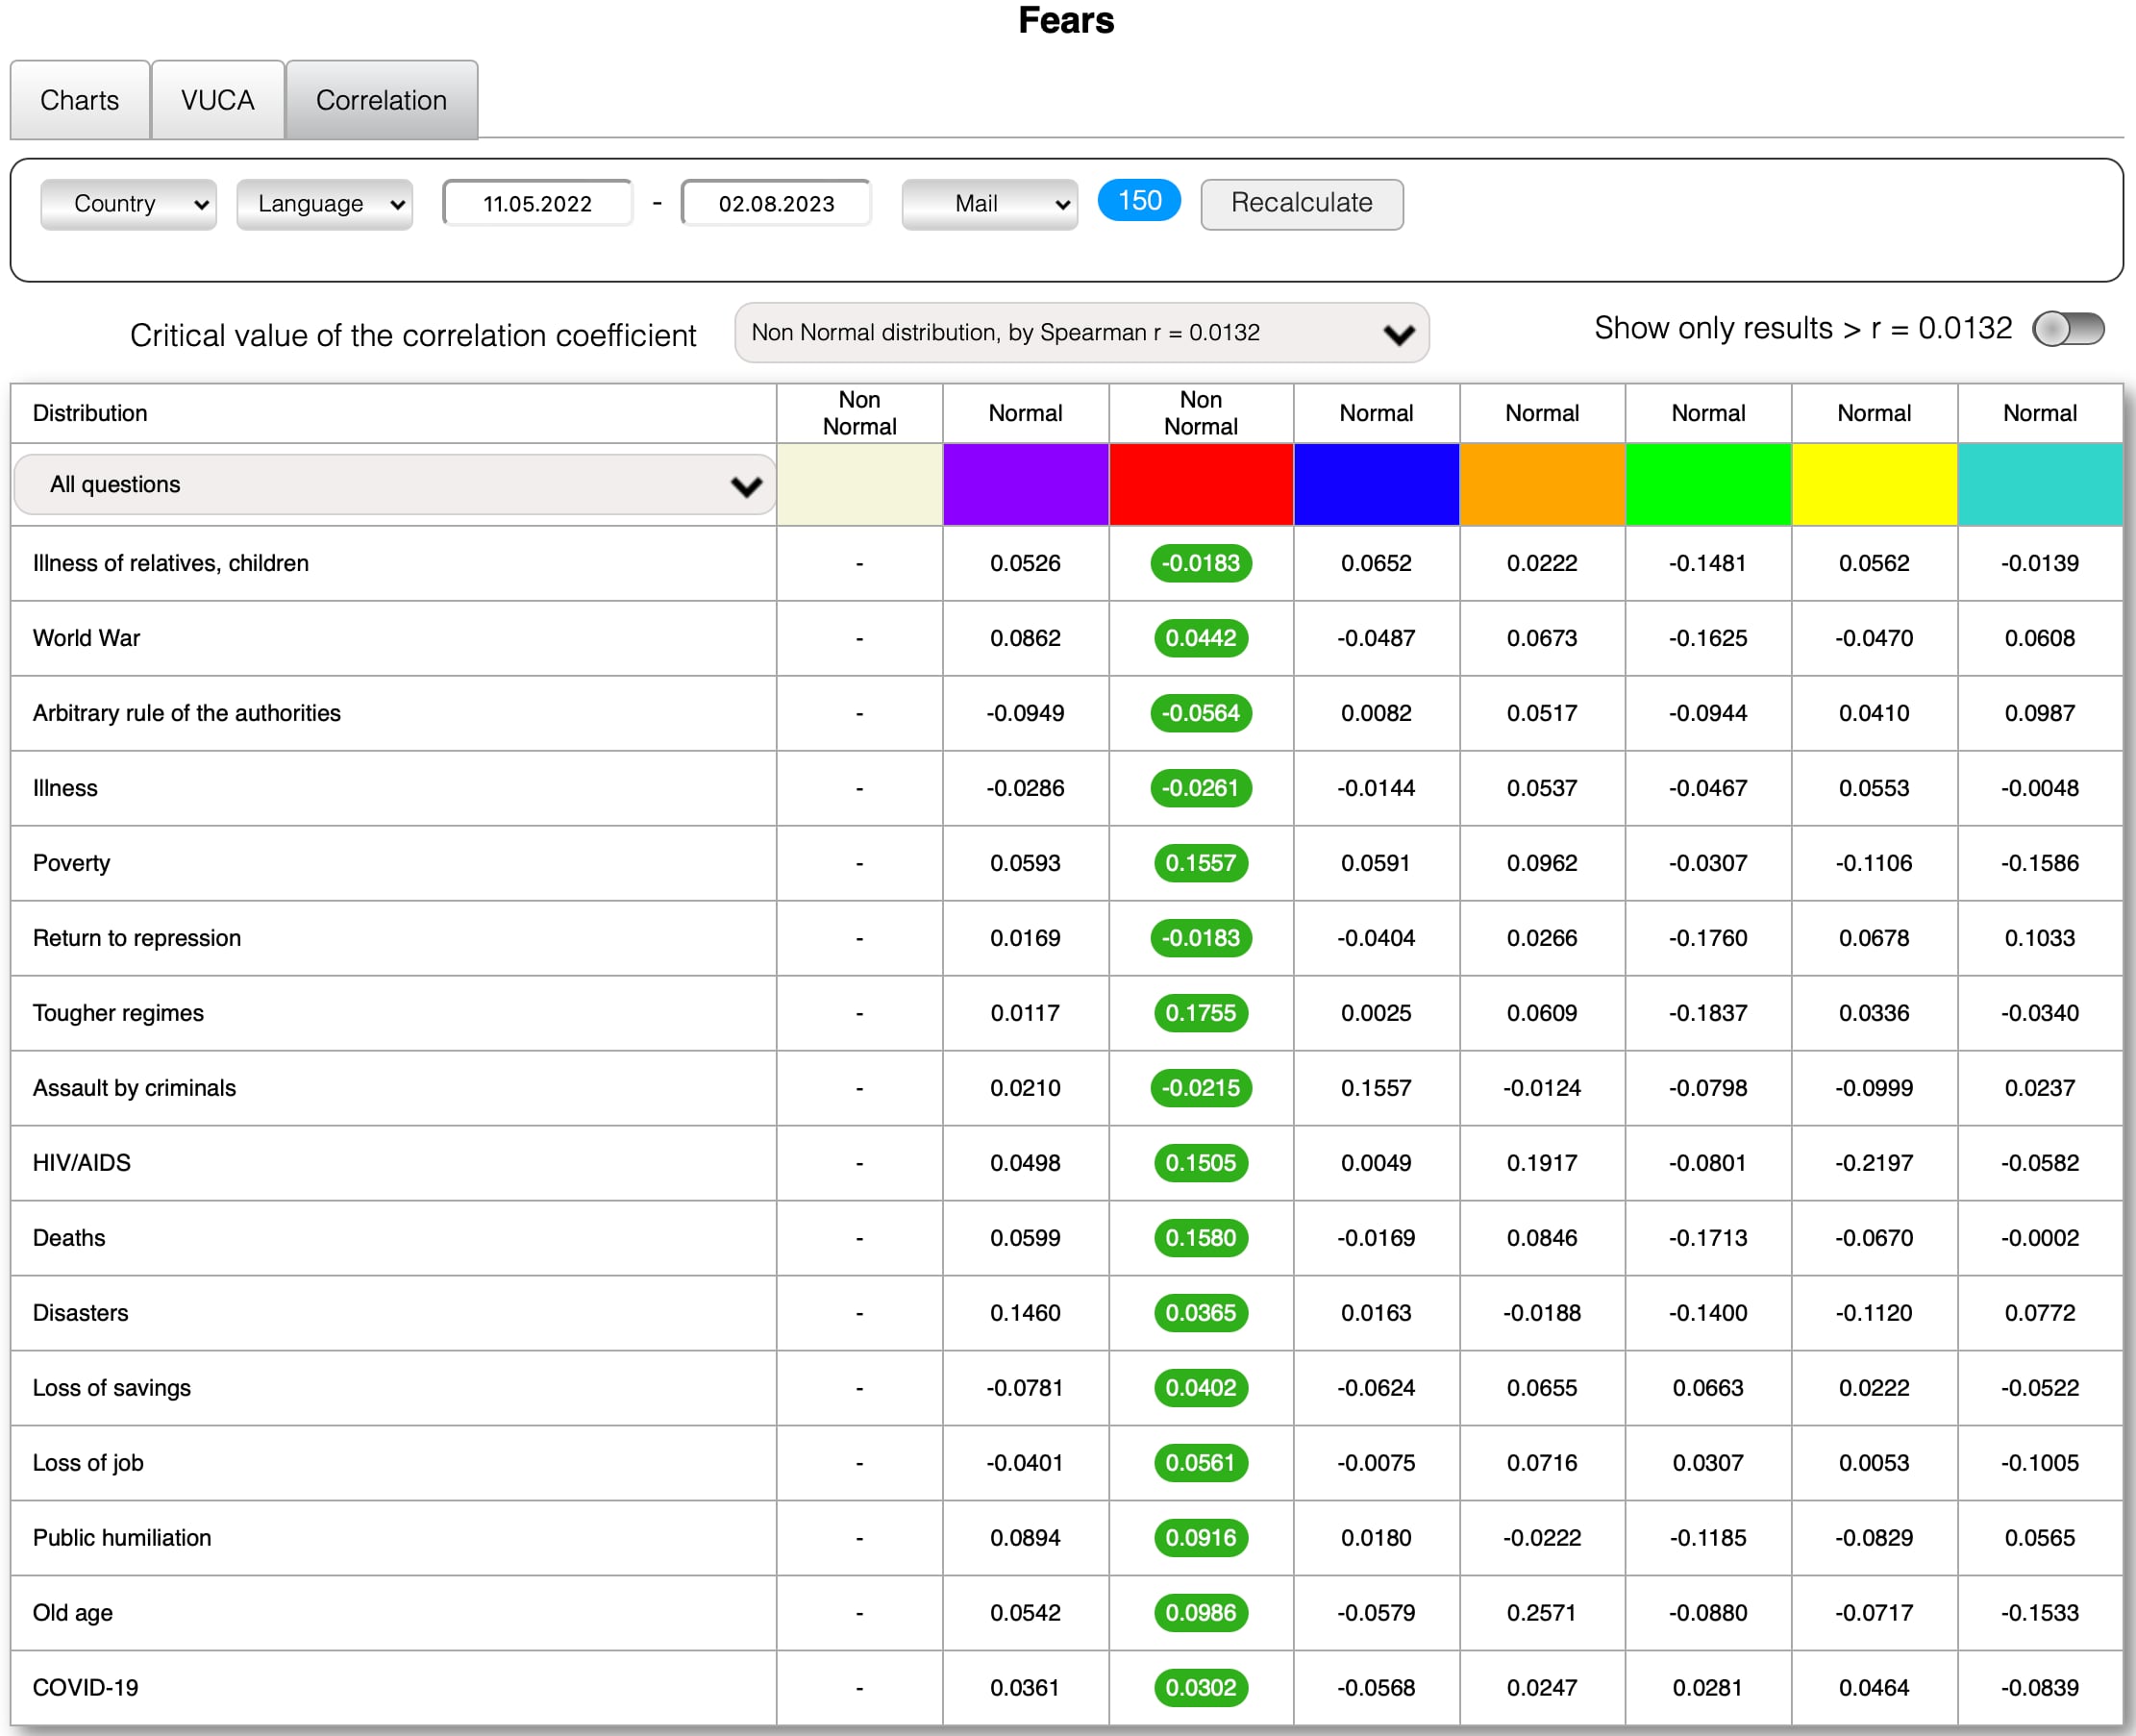
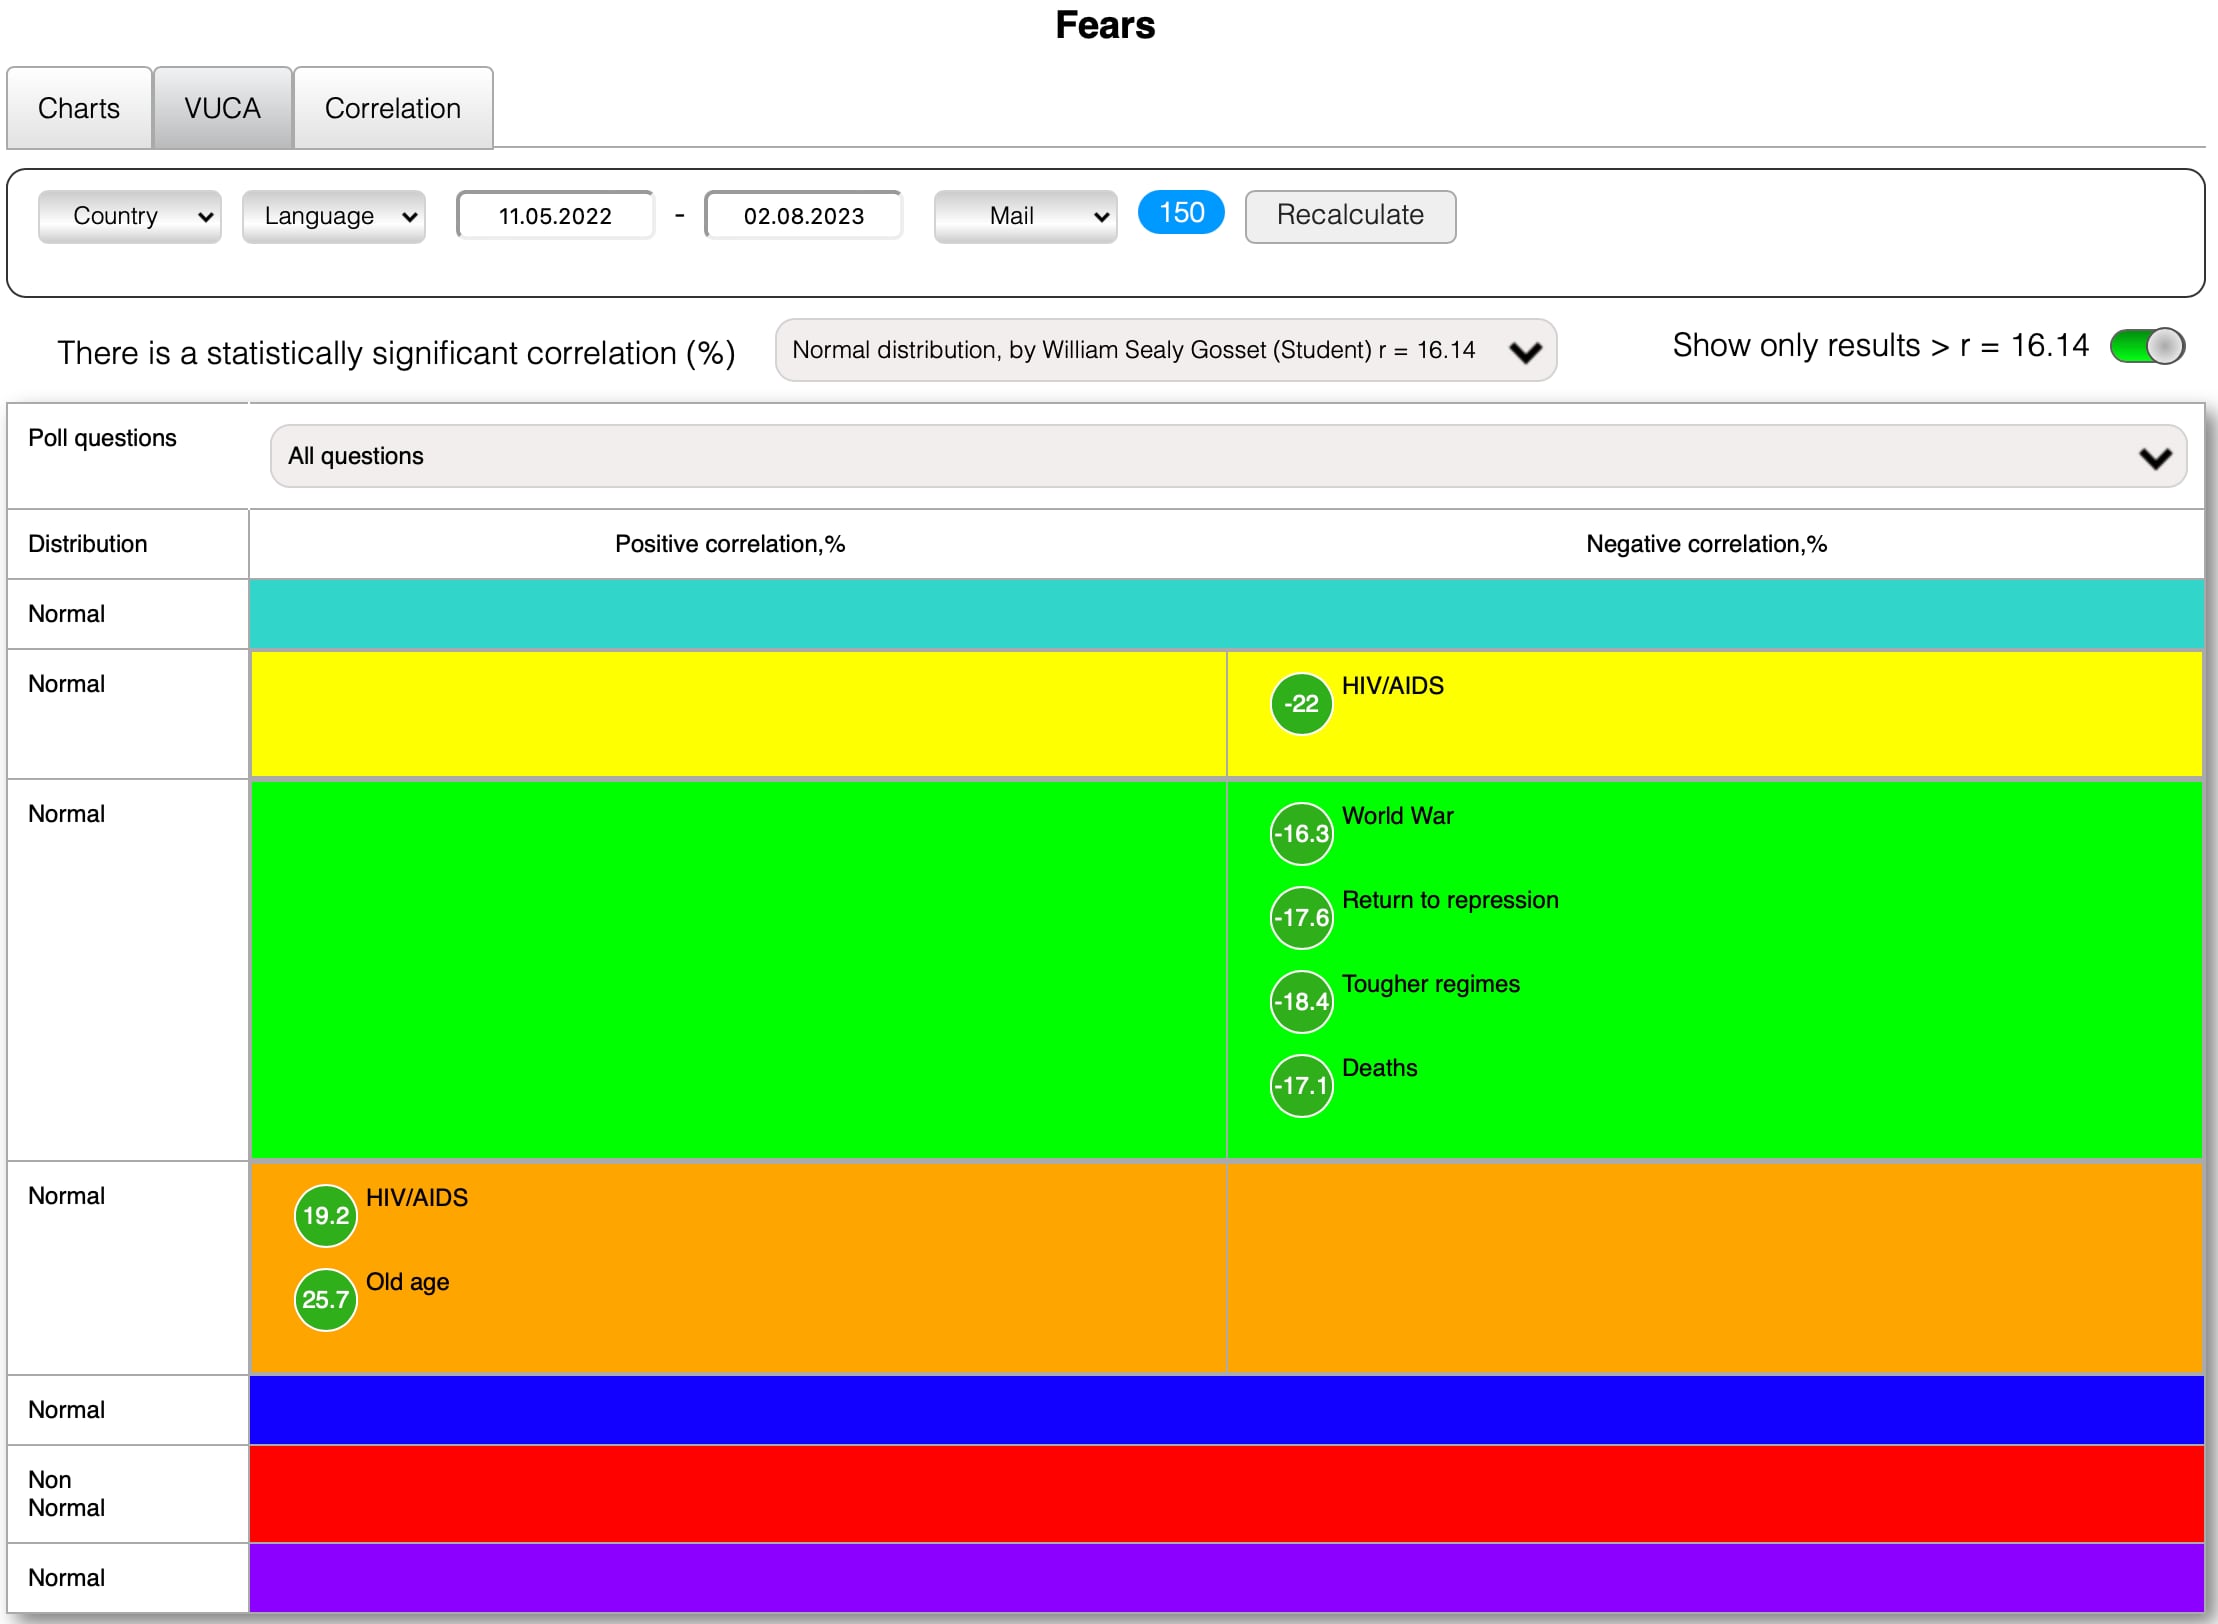
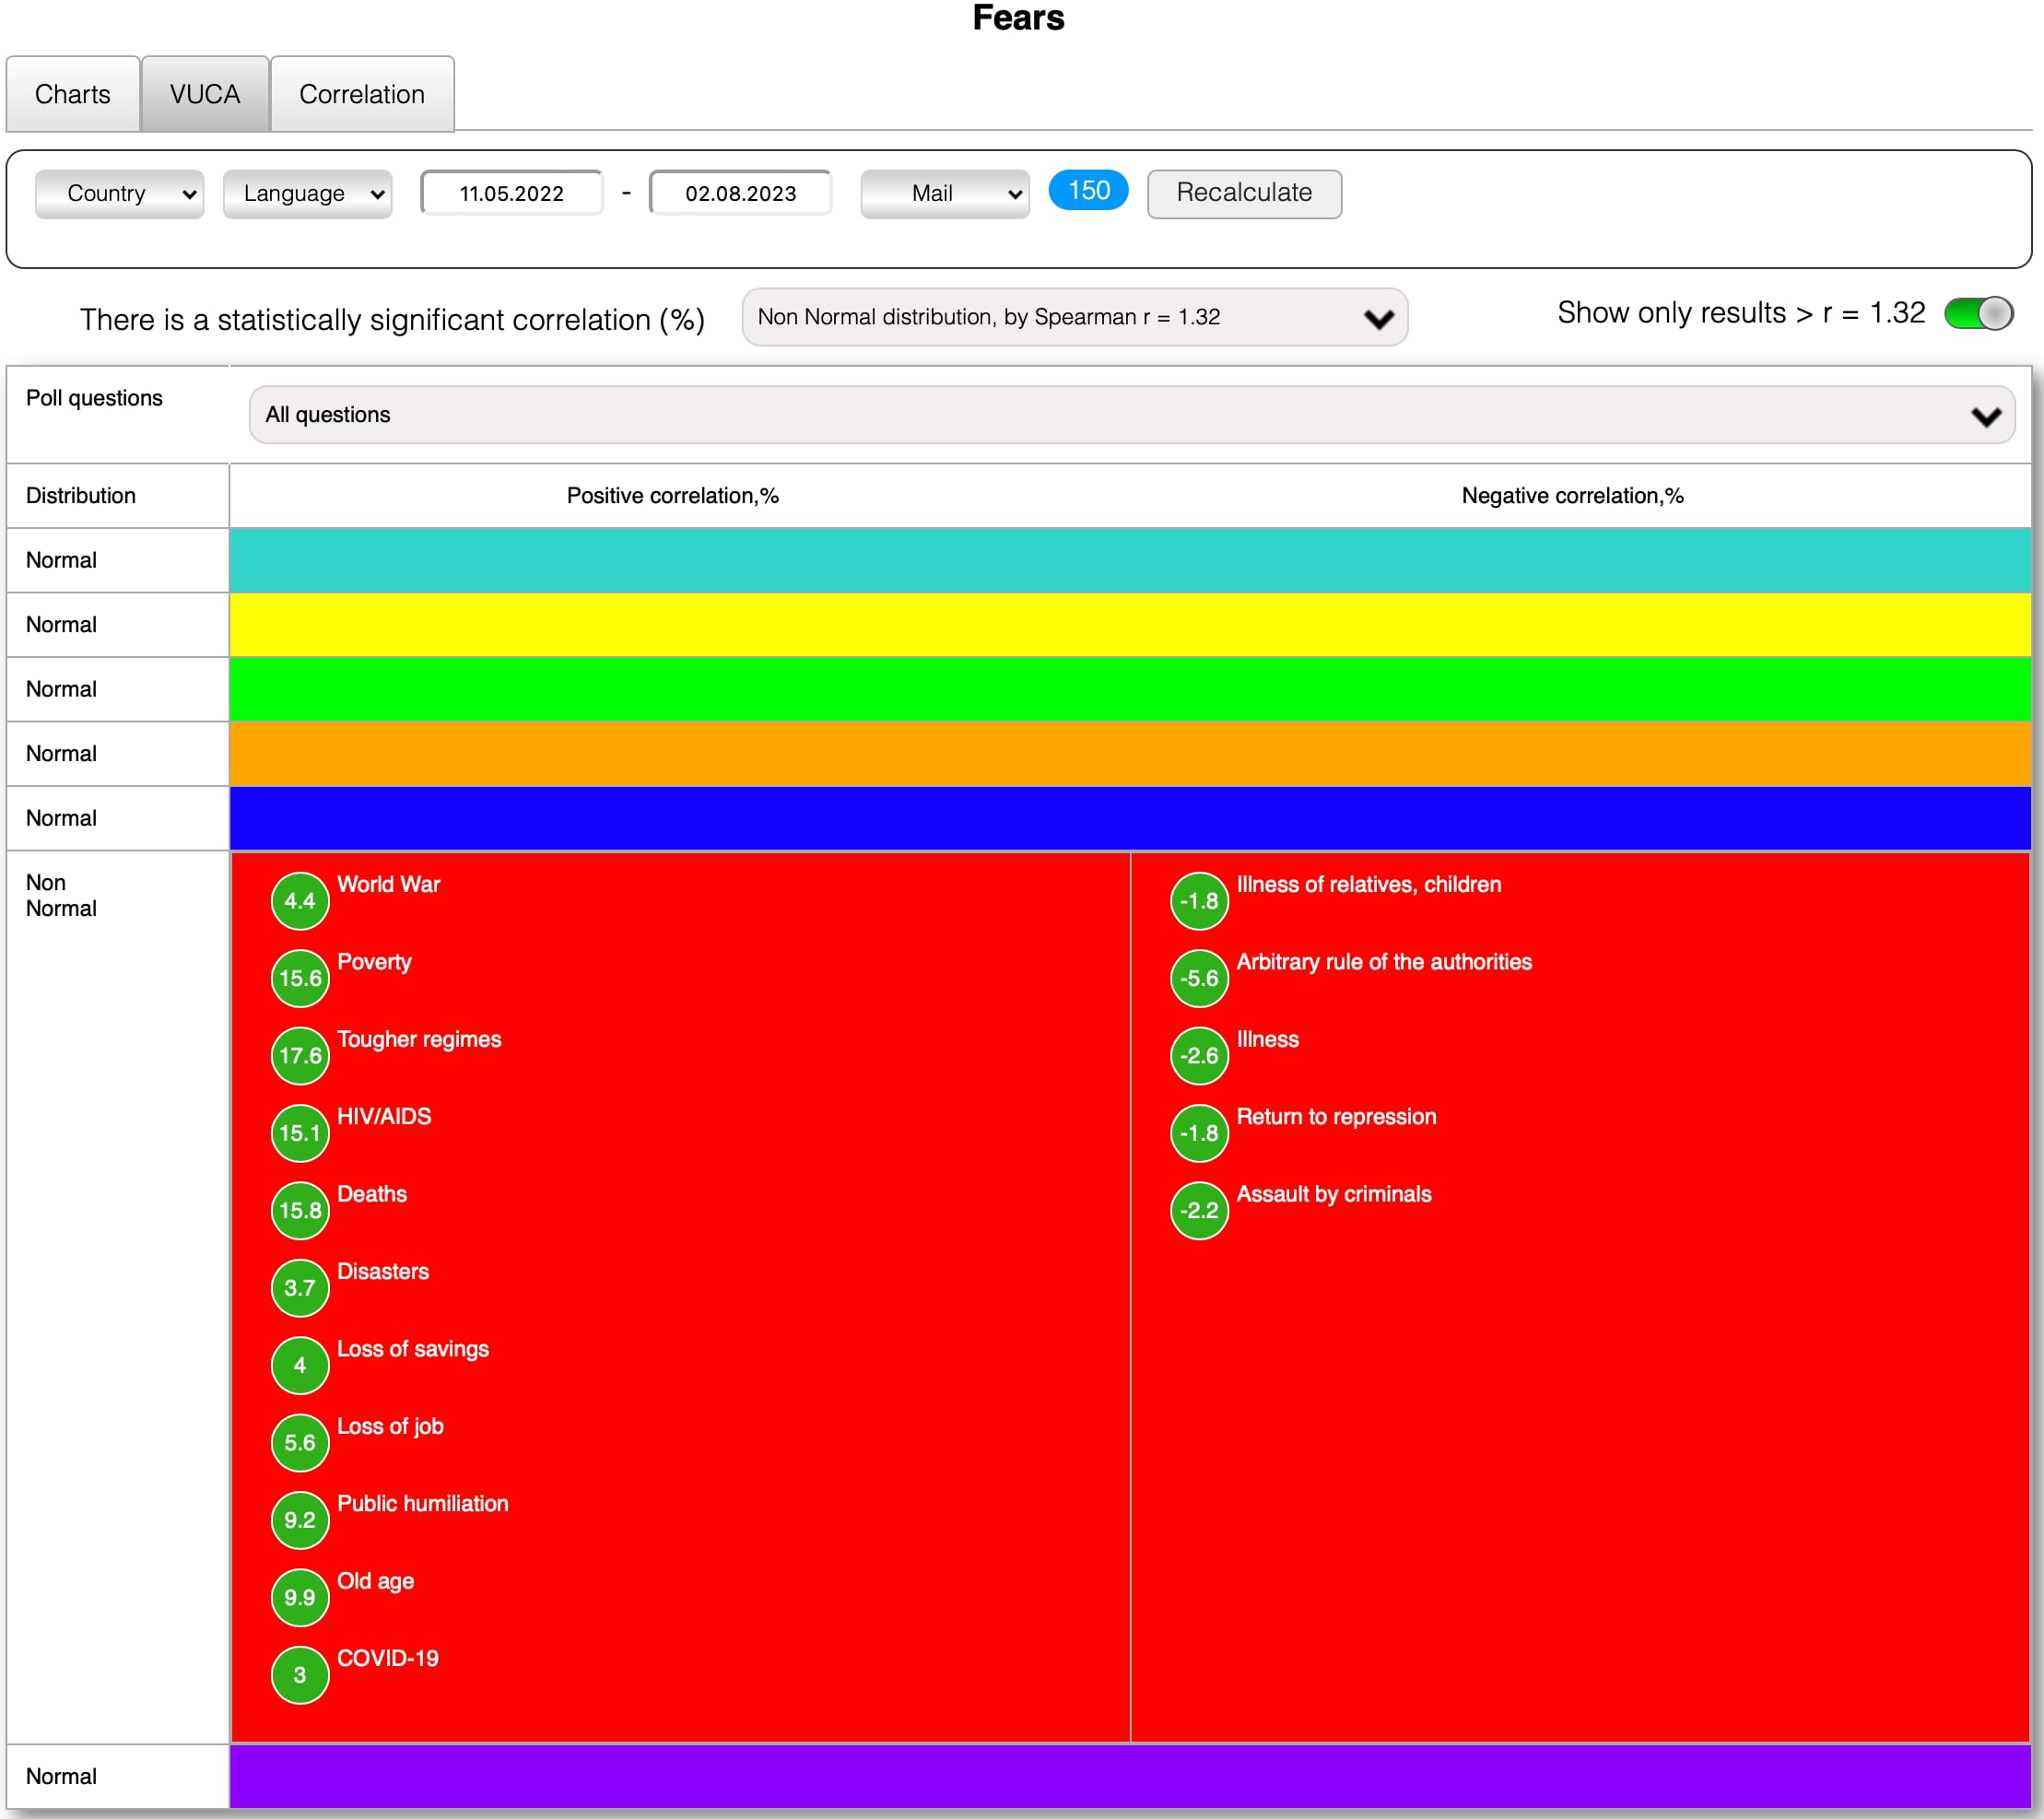
| Distribution | Non Normal | Normal | Non-Normal | Normal | Normal | Normal | Normal | Normal |
| FEARS / Spiral Dynamics colors | Beige | Purple | Red | Blue | Orange | Green | Yellow | Turquoise |
| Illness of relatives, children | - | 0,0527 | -0,0112 | 0,0672 | 0,0302 | -0,1487 | 0,0338 | -0,0088 |
| World War | - | 0,0678 | 0,0493 | -0,0282 | 0,0693 | -0,1416 | -0,0761 | 0,0602 |
| Arbitrary rule of the authorities | - | -0,0885 | -0,0473 | 0,0011 | 0,0667 | -0,1034 | 0,0125 | 0,1122 |
| Illness | - | -0,0355 | -0,0187 | -0,0108 | 0,0648 | -0,0371 | 0,0136 | 0,0081 |
| Poverty | - | 0,0516 | 0,1639 | 0,0652 | 0,1081 | -0,0221 | -0,1489 | -0,146 |
| Return to repression | - | -0,0009 | -0,0174 | -0,0269 | 0,0278 | -0,153 | 0,0377 | 0,107 |
| Tougher regimes | - | 0,0008 | 0,1714 | 0,0086 | 0,0573 |  -0,17 -0,17 | 0,0274 | -0,0335 |
| Assault by criminals | - | 0,0005 | -0,0106 |  0,1766 0,1766 | -0,0048 | -0,0564 | -0,142 | 0,0256 |
| HIV/AIDS | - | 0,0499 | 0,148 | 0,0078 |  0,1864 0,1864 | -0,0811 |  -0,1988 -0,1988 | -0,0654 |
| Deaths | - | 0,0503 | 0,1604 | -0,002 | 0,0825 |  -0,1616 -0,1616 | -0,0729 | -0,0065 |
| Disasters | - | 0,1284 | 0,0434 | 0,0373 | -0,0155 | -0,1215 | -0,1384 | 0,0747 |
| Loss of savings | - | -0,0883 | 0,0431 | -0,0461 | 0,0632 | 0,0764 | 0,0129 | -0,059 |
| Loss of job | - | -0,0324 | 0,0674 | -0,0098 | 0,0846 | 0,0204 | -0,0169 | -0,0944 |
| Public humiliation | - | 0,0978 | 0,1077 | 0,0161 | -0,0041 | -0,1296 | -0,1185 | 0,0684 |
| Old age | - | 0,0632 | 0,1126 | -0,0622 |  0,2762 0,2762 | -0,0997 | -0,1012 | -0,144 |
| COVID-19 | - | 0,0306 | 0,0314 | -0,0476 | 0,0227 | 0,0333 | 0,0424 | -0,0886 |
Graves, C. W. (1966). Deterioration of work standards. Harvard Business Review, 44(5), 117-128. - Graves' early research laying the foundations for his theories.
Rodgers, J. L., & Nicewander, W. A. (1988). Thirteen ways to look at the correlation coefficient. The American Statistician, 42(1), 59-66.
Beck, D. E., & Cowan, C. C. (1996). Spiral dynamics: Mastering values, leadership and change (1st ed.). Wiley-Blackwell.
Beck, D. E., & Cowan, C. C. (2005). Spiral dynamics: Mastering values, leadership and change. Wiley-Blackwell. - Useful for original Spiral Dynamics model source.
Petrie, N. (2011). Future trends in leadership development. Center for Creative Leadership. - Insights on leadership development.
Bleijenbergh, I. (2013). Kwalitatief onderzoek in organisaties. Boom Lemma.
Moore, D. S., McCabe, G. P., & Craig, B. A. (2013). Introduction to the practice of statistics (8th ed.). W.H. Freeman.
Bennett, N., & Lemoine, G. J. (2014). What a difference a word makes: Understanding threats to performance in a VUCA world. Business Horizons, 57(3), 311-317. - Background on emergence of VUCA framework.
Anderson, M., & Adams, W. A. (2016). Mastering leadership alignment linking value creation to cash flow. Routledge.
Uhl-Bien, M., & Arena, M. (2017). Complexity leadership: Enabling people and organizations for adaptability. Organizational Dynamics, 46(1), 9-20. - Relevance of complexity leadership in VUCA contexts.
